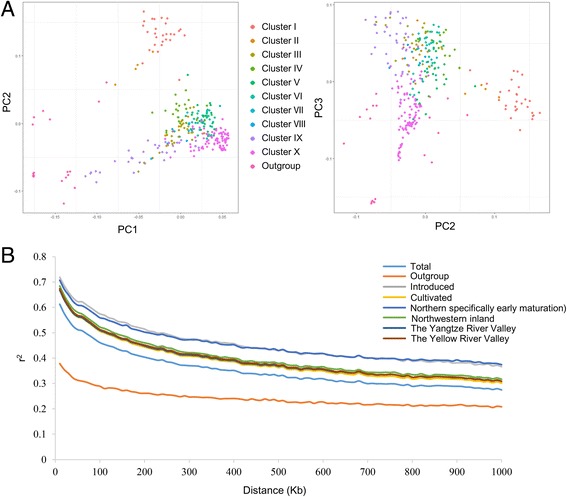
Fig. 5.

PCA and linkage disequilibrium analysis of the 332 cotton accessions. a PCA for the 332 cotton accessions based on CottonSNP80K genotyping data. b LD decay of r2 and physical distance between SNP markers in different cotton groups. The 332 cotton accessions were classified into the introduced landraces (named as Introduced), the Chinese modern improved cultivars respectively from the Yellow River Valley, the Yangtze River Valley, the Northwestern inland region and the Northern specifically early maturation region (named as Cultivated), and the outgroup (named as Outgroup). Samples from the same group are represented by the same color
