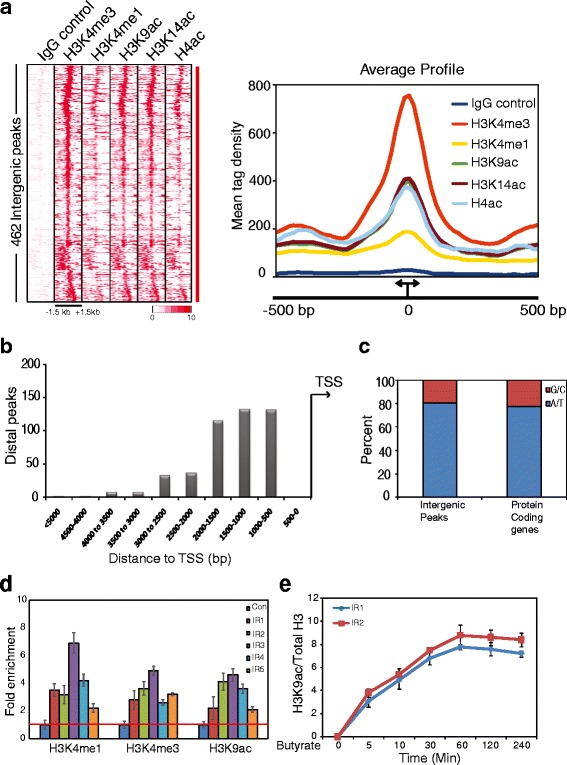
Fig. 1.

Identification of intergenic peaks which are associated with multiple histone modifications. In order to extract peaks of histone modifications, tag densities of histone modifications were calculated in the IRs as described in Materials and Methods section. a Heatmap was generated for the region +/− 1.5 kb around centre of the peak. Tag density of multiple histone modifications over the 462 intergenic peaks (+/− 1.5 kb around centre of the peak) are represented in the heatmap. b Distribution of intergenic peaks around the transcription start sites was calculated from the centre of the peaks. The closest peak is 750 bp upstream to TSS as the IRs located within 500 bp upstream of the gene have been excluded from the analysis. c AT/GC content of the intergenic peaks and protein coding genes was found comparable as the genome is approximately 80% AT-rich. d Presence of H3K4me1, H3K4me3 and H3K9ac over the intergenic regions validated by quantitative ChIP-PCR over randomly selected peaks. The ChIP-qPCR enrichment matches with the tag density per peak (data not shown). e Increase in histone H3K9ac over the intergenic peaks following HDAC inhibition by sodium butyrate was measured at indicated time points by ChIP-qPCR. ChIP-signal for histone H3K9ac was normalized to total H3. Control genomic region (primer sequence shown in Additional file 4: Table S1) did not show any increase in acetylation upon sodium butyrate treatment. Error bars represent the standard deviation calculated from three technical replicates
