Fig. 3.

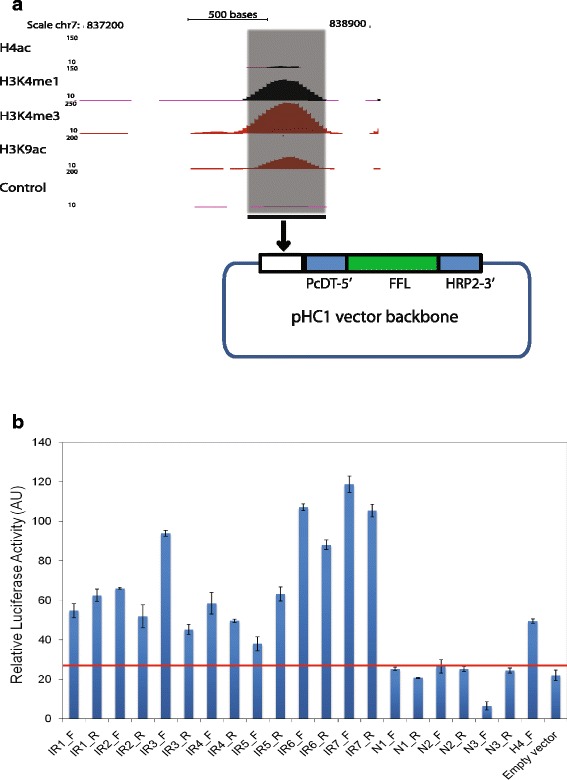
H3K4me1 marked intergenic peaks exhibit enhancer activity in enhancer luciferase assay. a UCSC snapshot of a representative intergenic peak having multiple histone modifications. The intergenic region (~ 1 kb) was cloned in an enhancer luciferase reporter vector. b Enhancer reporter (luciferase) assay was carried out to measure the activity of seven randomly selected intergenic regions (IR1 to IR 7) and compared to randomly selected negative genomic regions (N1-N3) and empty vector control in P. falciparum. F denotes forward orientation, whereas its opposite orientation (Reverse) is denoted as R. Earlier reported enhancer (H4) [15] was used as positive control. Intergenic regions showed enhancer activity in the enhancer luciferase assay independent of orientation. The red line indicates the activity obtained with control negative genomic region. Error bars represent the standard deviation for two biological replicates
