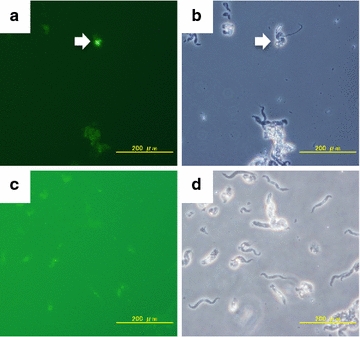
Fig. 3.

In situ hybridization. a Fluorescent image of in situ hybridization performed using the anti-sense probe. The picture was taken in 14-s exposure. Hybridization signal was indicated by the arrowhead. b Optical image of the same specimen shown in panel a. Arrowhead shows the individual that exhibited positive signal in panel a. c Fluorescent image of in situ hybridization performed using the sense probe. The picture was taken in 60-s exposure. No hybridization signal was observed. d Optical image of the same specimen shown in panel c. Bar 200 μm
