Fig. 3.

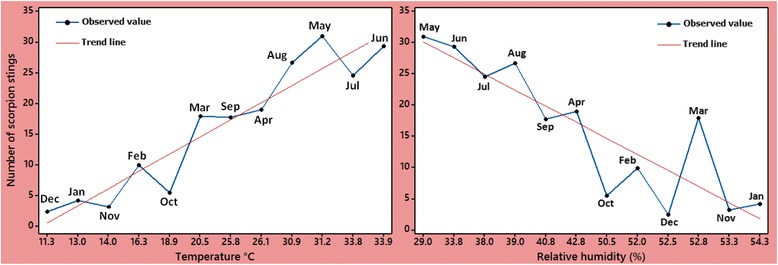
Distribution of average of scorpion sting cases with respect to average temperature (°C) and relative humidity (%) in different months of the years 2012 to 2016

Distribution of average of scorpion sting cases with respect to average temperature (°C) and relative humidity (%) in different months of the years 2012 to 2016