Fig. 7.

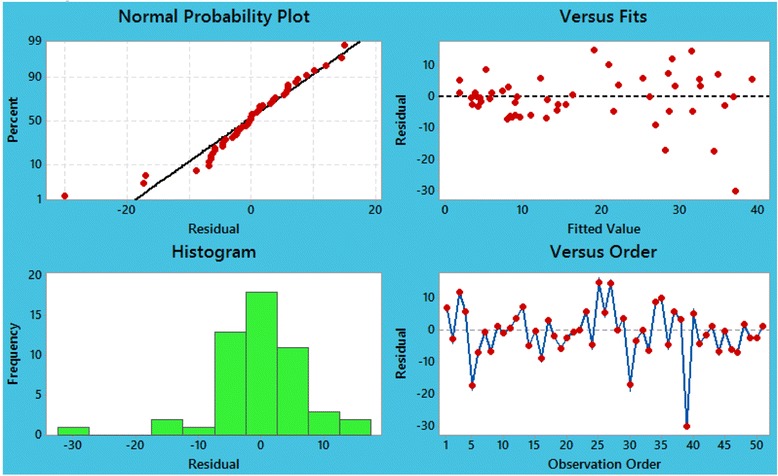
Plot of residual versus fitted values, histogram of residuals, normal probability plot, and plot of residual versus ordered times for scorpion sting cases in fitting mixed seasonal ARMA, ARMA (1, 1) × (0, 1) model at lag 12

Plot of residual versus fitted values, histogram of residuals, normal probability plot, and plot of residual versus ordered times for scorpion sting cases in fitting mixed seasonal ARMA, ARMA (1, 1) × (0, 1) model at lag 12