Fig. 9.

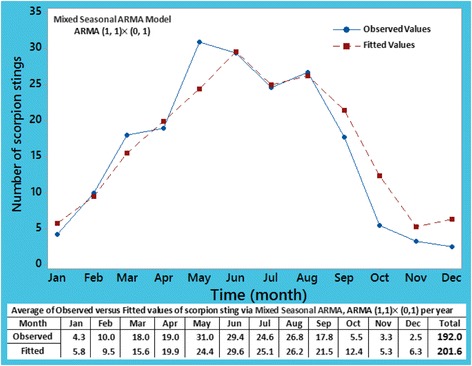
Plot of average of the observed and fitted values for scorpion sting cases in the years 2012 to 2016 using mixed seasonal ARMA, ARMA (1, 1) × (0, 1) at lag 12 model

Plot of average of the observed and fitted values for scorpion sting cases in the years 2012 to 2016 using mixed seasonal ARMA, ARMA (1, 1) × (0, 1) at lag 12 model