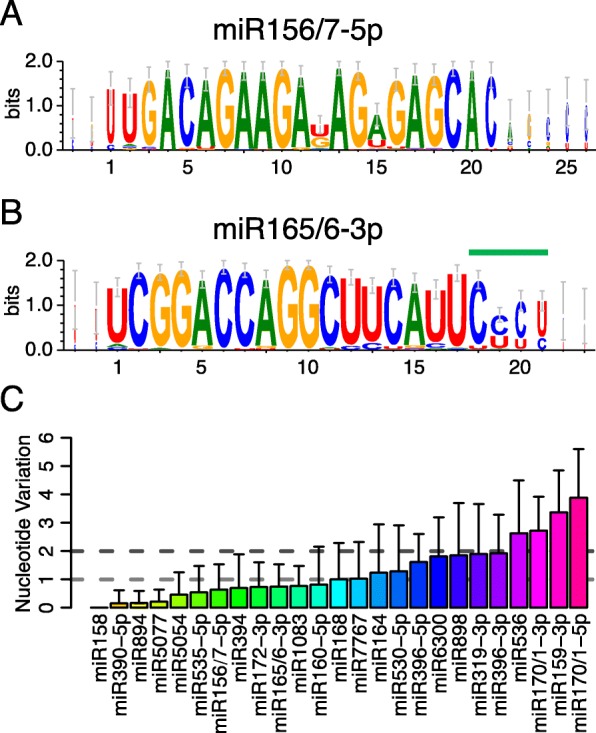
Fig. 6.

Conservation of miRNA candidates in conserved miRNA families. a, b Sequence logos showing the consensus sequences of miR156/157-3p and miR165/166-3p families from lycophytes and ferns. The overall height of each position indicates the conservation at this position (in bits), and the height of each nucleotide shows the relative frequency of this nucleotide at this position. In the miR165/166-3p family, nucleotides 19–21 (marked by the green line) are not as conserved as the 5′ end; this is probably because of 3′ truncation and U tailing. c Barplot for nucleotide variations in conserved miRNA families. Only the top one or two most abundant miRNAs in each miRNA family from each species were included in the analyses. The horizontal dotted lines indicate the average nucleotide variations of 1 and 2, respectively, and divide these miRNA families into three groups, families with average nucleotide variations less than 1, between 1 and 2, and more than 2. Different colors in the columns indicate various miRNA families and error bars represent standard deviations of nucleotide variations in each miRNA family
