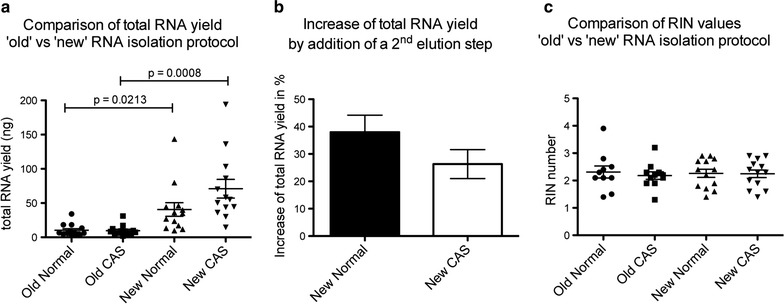
Fig. 3.

Direct comparison of RNA extracted from LCM samples from deparaffinised, stained FFPE tissue with the old vs the new isolation protocol. a Scatter plot with mean ± SEM of total RNA yield from the 13 clinical cases analysed obtained using the old vs the new isolation protocol. Old normal shows data obtained from using the old protocol on LCM samples of normal stroma, while old CAS shows data for the old protocol on CAS. New normal and new CAS are the equivalent for the new extraction procedure, respectively. p-values were calculated using the Student’s t test. b Bar graph displaying mean ± SEM of the increase of total RNA yield that could be achieved using a 2nd elution step with the new isolation protocol for normal and CAS samples, respectively, compared to a single elution step only. n = 8 for both types of tissue, respectively. c Scatter plot with mean ± SEM of the RIN values obtained from all 13 clinical cases isolated using the old or the new isolation procedure, respectively. RIN values could not be calculated for 3 samples of old normal and 2 samples of old CAS, and are thus omitted from this graph
