
Fig. 1.
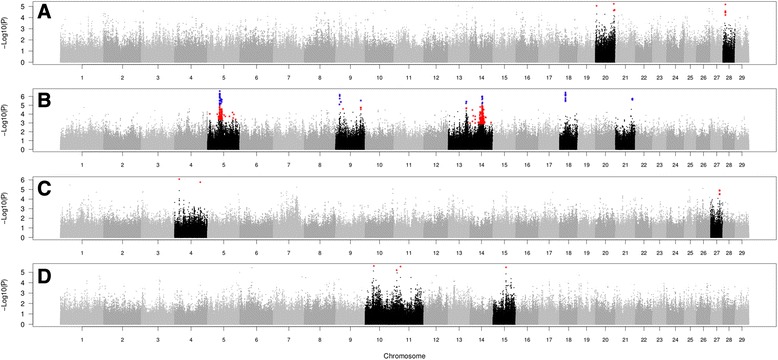
Manhattan plots for scrotal circumference at 210 d of age (a), scrotal circumference at 420 d of age (b), age at first calving (c), and age at second calving (d). Chromosomes with significant SNPs are highlighted in black. The significant SNPs, after false discovery rate correction of 10% (chromosome-wise), are highlighted in red. The significant SNPs, after false discovery rate correction of 10% (genome-wide), are highlighted in blue. On the y-axis are presented the –Log of the P-values for each SNP. On the x-axis are presented the autosomal chromosomes