
Figure 2.
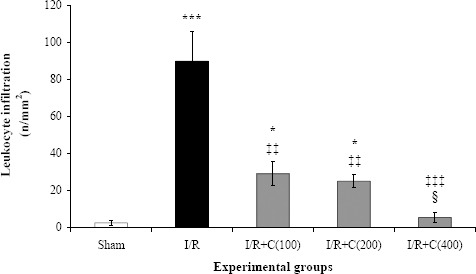
Leukocyte infiltration (mean±SE per square millimeters) at the end of the reperfusion period in rats which underwent renal ischemia/reperfusion (I/R) while pretreated with different doses (0, 100, 200, or 400 mg/kg) of crocin compared to the sham group
* P<0.05; ***P<0.001 in comparison with the sham group
‡‡ P<0.01; ‡‡‡ P<0.001 in comparison with the I/R group
¦ P<0.05 in comparison with the I/R + C(100) and I/R + C(200) groups