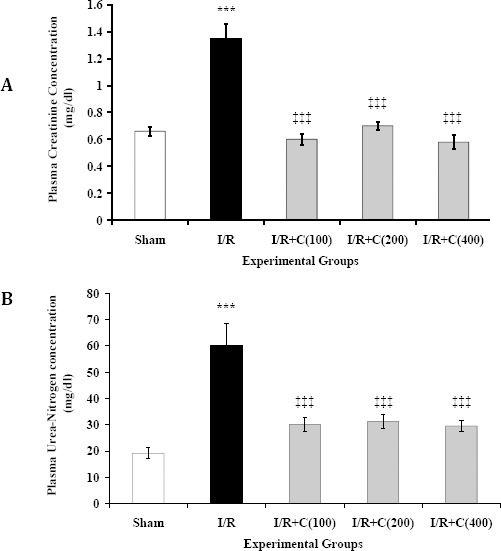
Figure 4.

Plasma creatinine (A) and urea-nitrogen (B) concentrations at the end of reperfusion period in rats which underwent renal ischemia/reperfusion and treated with crocin at zero (I/R), 100, 200, or 400 mg/kg (I/R + C) compared to the sham group. Data is presented as mean ± SE (n = 7), *** P<0.001 in comparison with the sham group. ‡‡‡ P<0.001 in comparison with the I/R group
