
Figure 2.
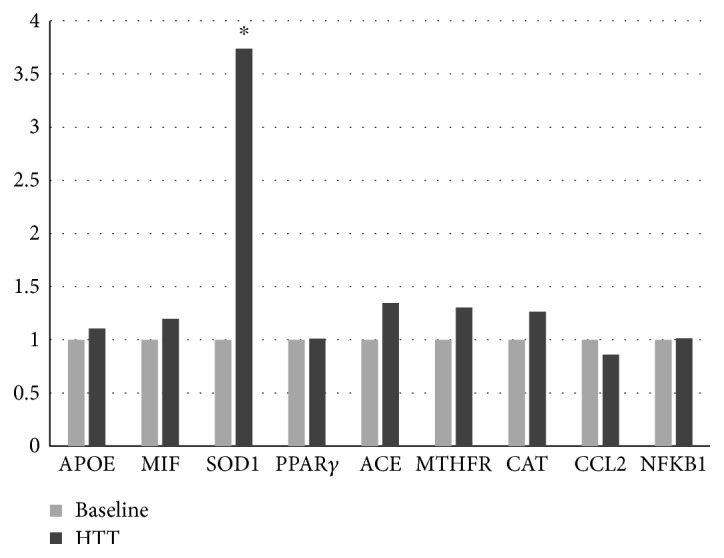
Gene expression on baseline and after HTT. Different levels of fold change of genes analyzed baseline (B) and HTT; ∗p < 0.05. APOE: apolipoprotein E; MIF: macrophage migration inhibitory factor; SOD1: superoxide dismutase 1; PPARγ: peroxisome proliferator-activated receptor gamma; ACE: angiotensin I-converting enzyme; MTFHR: methylenetetrahydrofolate reductase; CAT: catalase; CCL2: chemokine (C-C motif) ligand 2; NFkB1: nuclear factor of kappa light polypeptide gene enhancer in B-cells 1.