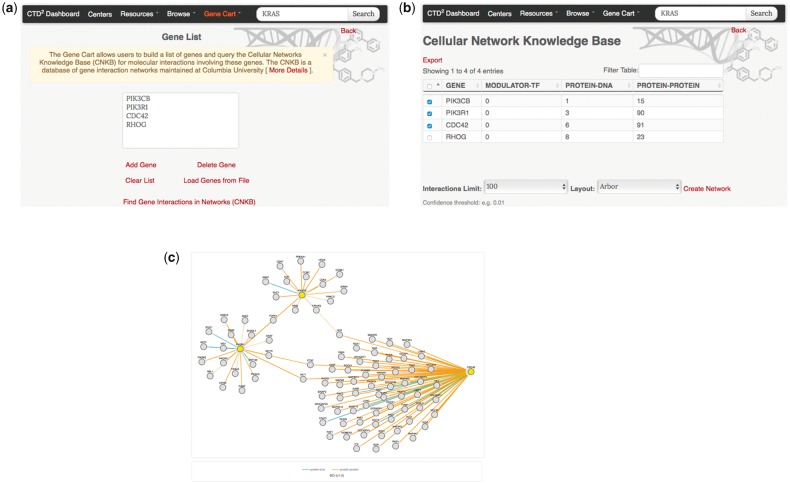
Figure 5.
The CTD2 Dashboard Gene Cart feature. (a) The ‘Gene Cart’ link available on the top navigation bar leads to a page that lists all genes that have been added by the user. From this page, users can add or remove genes from the list and initiate a query of the Cellular Networks Knowledge Base. (b) After selecting interactome type and version (in this example, B-Cell Interactome v1.0 was chosen) query results are summarized in a tabular view, with one row per query gene. Each row shows the number of interactions involving the corresponding gene, categorized according to interaction type (protein–DNA or protein–protein). Results can be exported as a SIF format file for display in third-party software such as Cytoscape (29,30). (c) Users can also select one or more of the query genes and click on the ‘Create Network’ link to generate a graph view of the interactions. Nodes in yellow represent query genes. Edges represent interactions and are colored according to the type of interaction.

