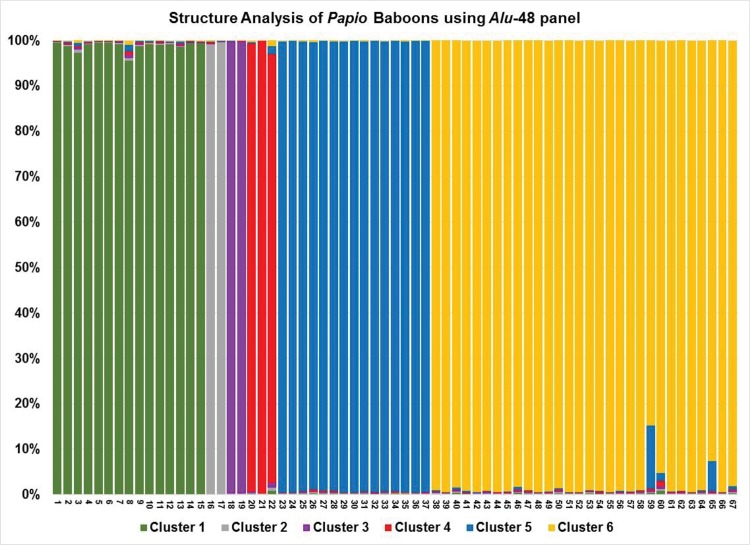
Fig. 1.—
Structure analysis of 67 Papio baboon individuals using the Alu-48 panel. The y axis shows the probability of assignment of each individual to six population clusters. The x axis shows baboons numbered 1–67 listed in the same order as supplementary file S3, Supplementary Material online. Individuals 1–15 are olive baboons (P. anubis), 16–17 are hamadryas baboons (P. hamadryas), 18–19 are Guinea baboons (P. papio), 23–37 are kinda baboons (P. kindae), and 38–67 are yellow baboons (P. cynocephalus) from the Mikumi National Park, Tanzania. K = 6 population clusters matches the recognized number of Papio species and captures the majority of structure in the data.

