Figure 1.
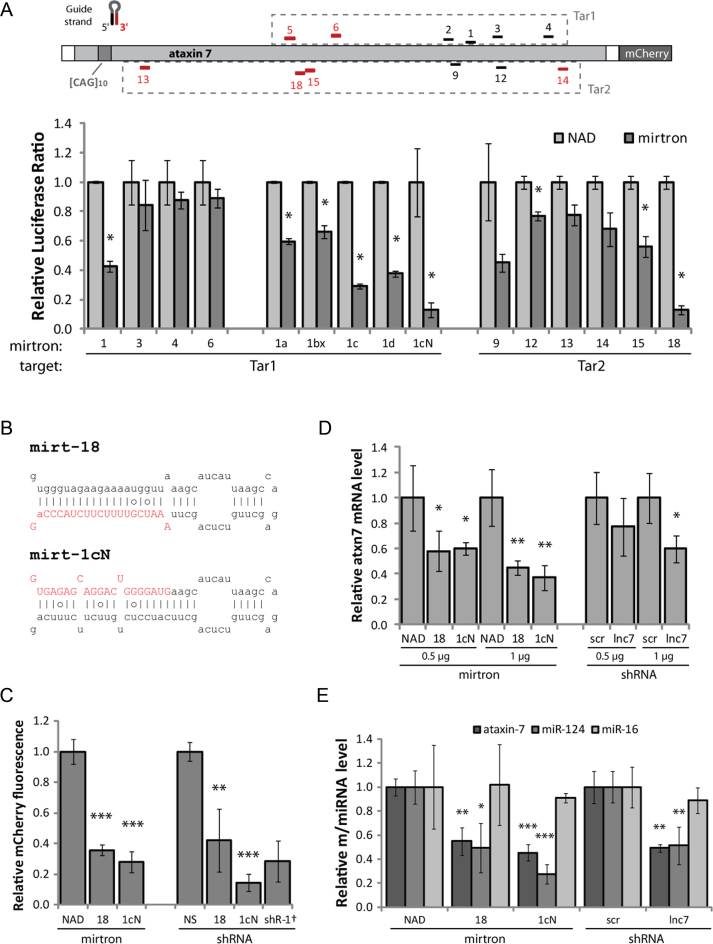
Mirtrons were developed to silence ataxin 7. Forty eight hours transfections were carried out and the measurement obtained with each control (nontargeting NAD intron or nonspecific shRNA) was set as 1. (A) Mirtrons were designed against various target sites within the ataxin 7 cDNA sequence, utilizing either the 5΄ or 3΄ mirtron arm as indicated (black/red respectively). Target sequences were incorporated into the 3΄ UTR of Renilla luciferase of a dual-luciferase construct (Tar1/Tar2, dashed boxes). Relative normalized Renilla-to-firefly luciferase ratios are shown for each mirtron against the appropriate target, co-transfected in HEK-293 cells. Values are the mean±standard deviation (SD) of N = 3. (B) Sequence and predicted secondary structure of mirt-18 and mirt-1cN, with intended mature miRNA in red uppercase letters. Lines indicate Watson–Crick base pairs, circles indicate weak (G-U) base pairs. (C) Relative mCherry fluorescence, indicating silencing activity of mirtrons and shRNAs against full-length mCherry-tagged mutant ataxin 7 containing an expansion of 100 glutamines (ataxin 7-Q100-mCherry), co-transfected in HEK-293 cells. Values are mean ± SD of N = 6, except †N = 5. (D) qPCR analysis of endogenous ataxin 7 mRNA in patient-derived fibroblasts, normalised to 18S. Values are mean ± SD of N = 4. (E) qPCR analysis of endogenous ataxin 7 mRNA, miR-124 and miR-16 in SH-SY5Y cells, normalised to 18S. Values are mean ± SD of N = 4. *P < 0.05, **P < 0.005; ***P < 0.0005 (one-tailed t-test) compared to the appropriate control (NAD for mirtrons or shR-NS/scr for shRNAs).

