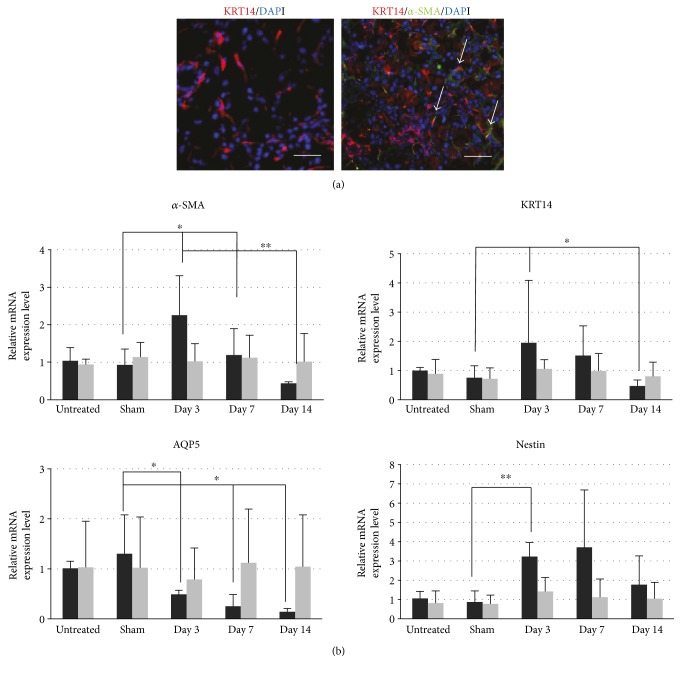
Figure 3.
Expression changes in representative markers in the LG after surgery. (a) The histoimmunochemical staining of KRT14 and α-SMA in the normal LG (red showed the KRT14, green showed the α-SMA, and arrow showed the cells with both expression). The scale bar is 50 μm. (b) The difference of relative mRNA expression level of the representative markers before and after surgery. ∗p < 0.05 and ∗∗p < 0.01.

