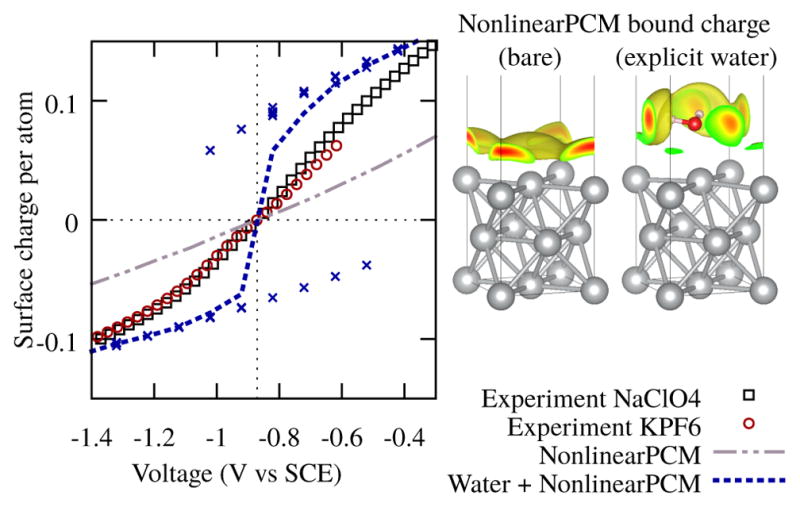
FIG. 2.

Left: Surface charge as a function of electrode potential for a Ag(100) surface with continuum solvation, and with a single (DFT) water molecule above the surface. The blue points are individual minimized configurations of the water, and the blue line is the thermodynamic average of the two configurations, using the Gibbs free energies of the configurations at a given potential. Right: Bound charge in the continuum solvent above the bare Ag(100) and surrounding the single explicit water molecule above Ag(100) at 0.6 V above PZC.
