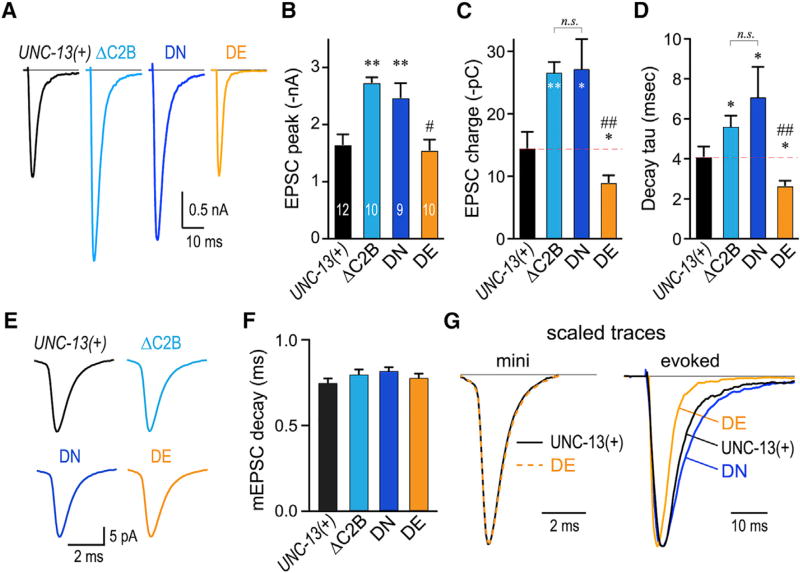
Figure 3. Calcium-Triggered Release Is Inhibited by the Calcium-Free Mimetic C2B and Stimulated by Calcium-Bound C2B Mimetic.
(A) Averaged stimulus-evoked EPSC traces for unc-13(s69) animals rescued with transgenes encoding full-length UNC-13 (UNC-13(+); black), ΔC2B (light blue), worm DN (navy), or worm DE (orange).
(B–D) Summary of peak currents (B), cumulative charge (C), and EPSC decay time constants (D) for all four genotypes.
(E) Average miniature EPSC (mEPSC) traces.
(F) Summary of average mEPSC decay time constant (single exponential fit) for the four genotypes.
(G) Average UNC-13(+) (black) and DE (orange) rescue mEPSC traces (left) and average evoked EPSC (right) for same transgenic animals scaled and superimposed. DN (navy) is also superimposed for comparison. Note the difference in scale bar time.
Errors bars are mean ± SEM with experiment numbers included in bars. *p < 0.05, **p < 0.01; n.s., not significant; #, significant difference from ΔC2B and DN, but not UNC-13(+) with p < 0.01; ##; significant difference from ΔC2B and DN with p < 0.01. Multiple comparisons using ANOVA and Tukey-Kramer statistics. Strains: JSD805, JSD835, JSD849, and JSD1038.

