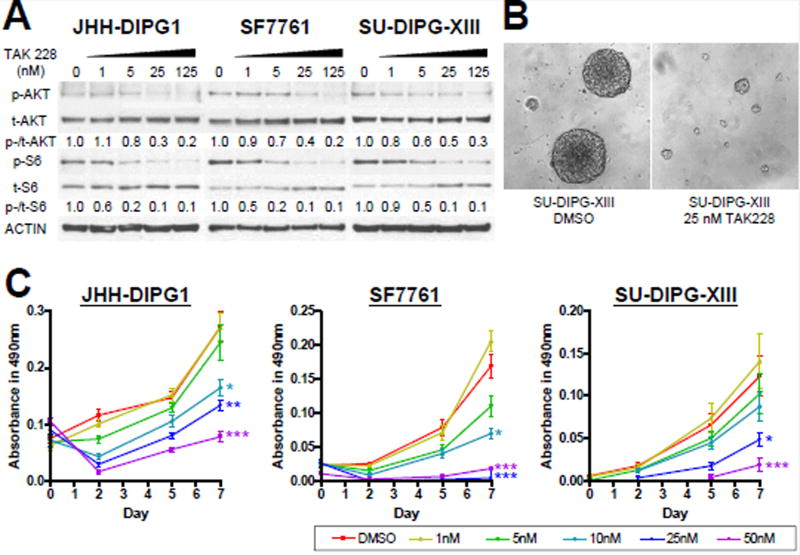
Figure 1. TAK228 inhibited mTOR pathway activity and suppressed cell growth in DIPG lines at nM concentrations.
A) Western blot showing dose-dependent suppression of both p-AKTS473 and p-S6S240/244 by TAK228. ACTIN was used as a loading control. Protein levels were quantitated using densitometry, and values normalized to DMSO control are depicted below the blots. B) High power (400X) photomicrograph comparing DIPG neurospheres of treated cells (right) as compared to control DMSO cells (left). C) MTS viability assay showing cell growth inhibition of all DIPG lines by 25–50 nM TAK228 compared to DMSO. ***: p <0.0001, **: p <0.01, *: p <0.05 vs. DMSO by Student’s t-test.

