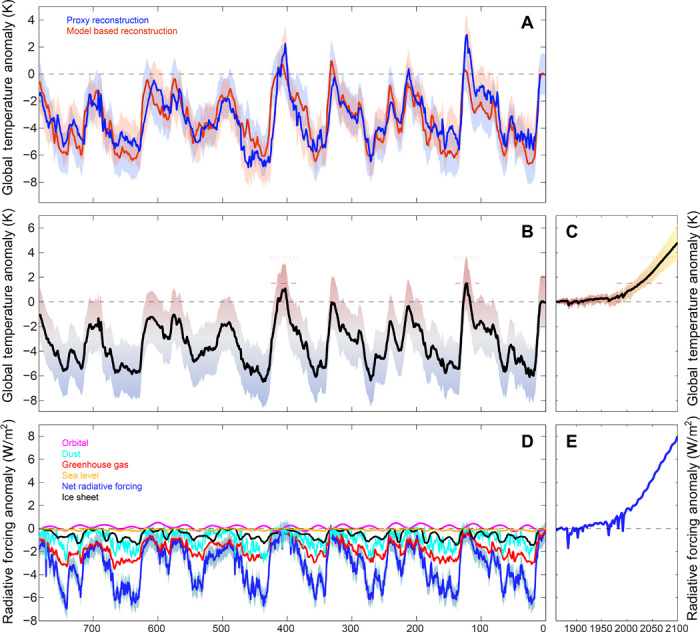
Fig. 2. Reconstructed global mean temperatures.

Globally averaged SAT (K) and radiative forcing anomalies (W/m2) for the last 784 ka and for the RCP8.5 scenario. (A) Global mean SAT anomalies (K) reconstructed from 14 long-term paleoproxies of SST (blue line) and from the transient model simulation (red line). Anomalies were calculated with respect to PI times. (B) Averaged, reconstructed global mean SAT anomaly (K, black line). Shading denotes uncertainty of ±2.12 K (see Materials and Methods). (C) CMIP5 ensemble mean projection for globally averaged SAT increase (K) with respect to PI mean state using RCP8.5 (black line) (6). Shading denotes ensemble SD. Dashed horizontal lines in (B) and (C) denote reconstructed maximum global mean SAT during the last 784,000 years (B) and its exceedance (C). (D) Radiative forcing anomalies (W/m2) with respect to PI mean state. Cyan, dust forcing; red, greenhouse gas forcing; black, ice sheet forcing; magenta, orbital forcing; brown, sea-level forcing; blue, sum of radiative forcings (see also fig. S7). (E) Radiative forcing anomalies (W/m2) with respect to PI mean state used for the CMIP5 RCP8.5 simulations (6).
