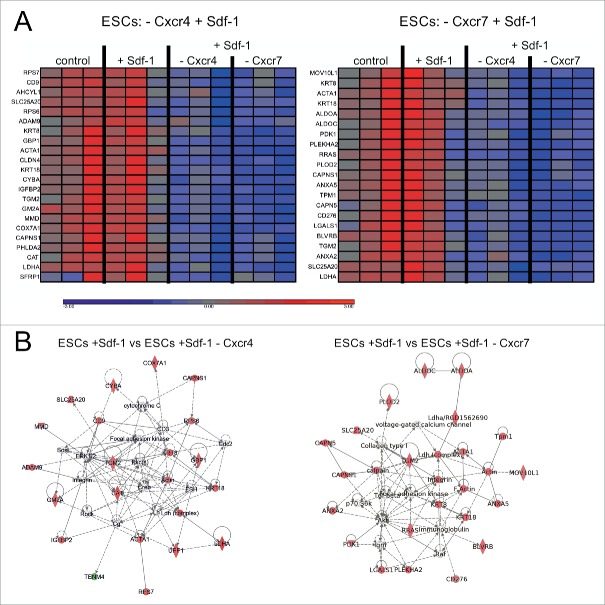
Figure 5.
Sdf-1 impact at global gene expression in in vitro cultured ESCs. (A) Transcription profile of genes in ESCs. Blue color indicates low and red color indicates high expression levels of mRNA transcripts. (B) Gene networks created by interposing the results onto database of Ingenuity containing information about the gene function with the use of Ingenuity Pathway Analysis tool.

