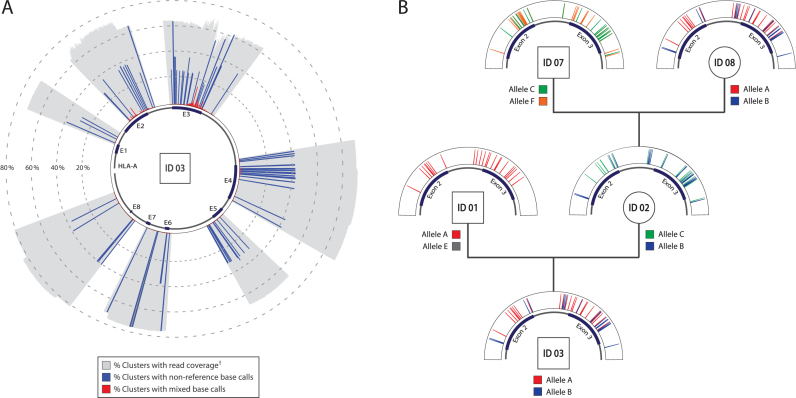
Figure 2.
Assay haplotyping results visualized. (A) Data from all clusters with ≥20 reads, for the singleplex reaction carried out with sample ID 03. † Base calling of each position supported by ≥5 reads with a quality score of ≥20. (B) Pedigree visualization of allele heredity for extended family of individuals and a more focused view (targets covering exons 2 and 3) of non-reference base calls for each allele identified within these samples.

