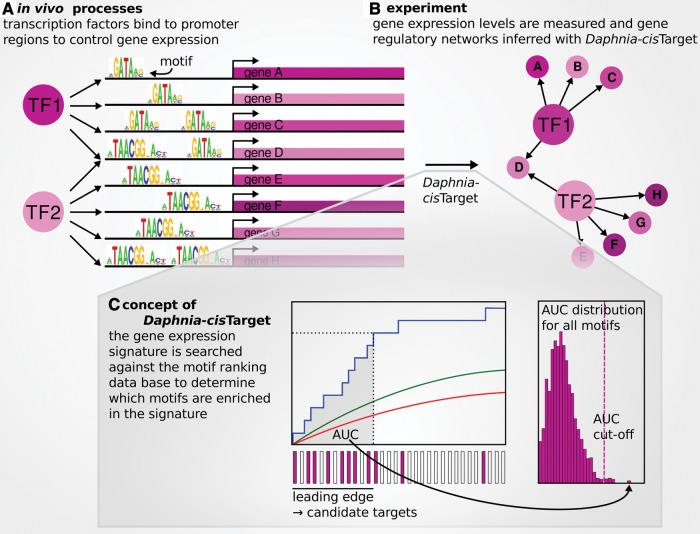
Fig. 1.—
Daphnia-cisTarget. (A) Transcription factors (TFs) bind to specific motifs in cis-regulatory regions to control gene expression. (B) This in vivo process can be inferred in silico by combining motif discovery and gene expression data, since genes that are coexpressed and share the same motif are likely to be regulated by the same transcription factor. (C) For a given input gene set, Daphnia-cisTarget generates a cumulative recovery curve for each motif ranking in the database (blue line left panel). The area under this curve (AUC) is calculated as a measure of enrichment (grey area), and those motifs that surpass the AUC cut-off (dotted line right panel) are listed in the output. The red line in the left panel represents the average recovery over the entire motif ranking database. This average plus two standard deviations yields the green line.

