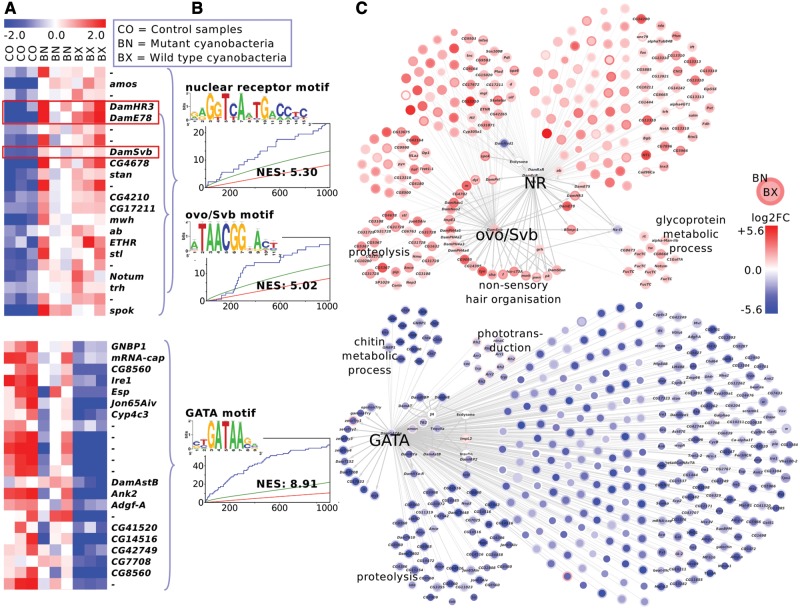
Fig. 3.—
Chronic cyanobacteria treatment in Daphnia magna. The upregulated genes (top, red network) contain nuclear receptor (NR) and ovo/Shavenbaby (ovo/Svb) motifs, along with transcription factors that potentially target those motifs (red boxes). The downregulated gene sets (bottom, blue network) are enriched for GATA motifs. (A) The heatmap shows median-centered expression levels (red: upregulation, blue: downregulation). For illustration purpose, only a selection of differentially expressed genes is displayed. The gene names refer to D. melanogaster homologies (“-”: no homology) or manual annotation (Dam*). (B) Sequence logos of Daphnia-cisTarget top scoring motifs, enrichment curve and normalized enrichment score (NES) of those motifs. The curly brackets indicate which genes in panel A are enriched for the respective motif in panel B. (C) Gene regulatory network including all putative target genes of one or several nuclear receptors, ovo/Svb and GATA factors. The node color intensity corresponds to the log2-fold change in the BX treatment (node center) and BN treatment (node border). The labels at gene subsets indicate gene ontology enrichment results. In subsets without gene ontology labels, genes arranged in left semi-circles do not have annotations based on homologies to D. melanogaster.

