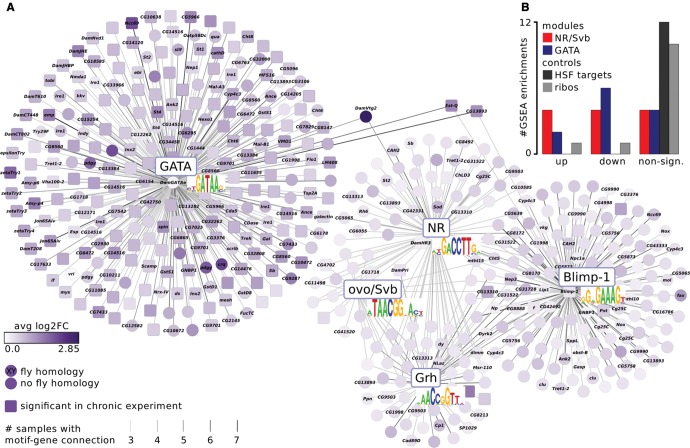
Fig. 5.—
The moulting- and growth-related networks respond to acute as well as to chronic cyanobacteria stress. (A) The gene regulatory networks are based entirely on the acute experiment. We found two additional motifs of the transcription factors Blimp-1 and Grh. Genes encoding those factors were differentially expressed in the chronic data, but their motifs were not enriched, indicating a higher motif discover resolution in the acute data set. The midgut- and ecdysone/cuticle-related subnetworks display the same dichotomy as in the chronic data set. The subnetworks are connected by only three genes, including the egg yolk gene DamVtg2, which is known to be regulated by ecdysone and a GATA factor in mosquitoes (Martín et al. 2001; Park et al. 2006). The network displays genes that belong to the most differentially expressed genes in any of the within-cohort treatment/control comparisons and have a motif instance in at least 3 (of 12) comparisons. Edge color intensity reflects the number of comparisons in which the motif-gene connection was found, node color intensity the absolute value of log2-fold change averaged across all comparisons. Squared nodes represent genes that are significantly differentially expressed in the chronic data set. (B) The gene regulatory networks from the chronic experiment were significantly enriched in the acute experiment. The bar plot is based on gene set enrichment analysis (GSEA) enrichments in supplementary fig. S5B, Supplementary Material online. It depicts how often the NR/Svb (red) and GATA (blue) modules derived from the chronic experiment were significantly up- or downregulated (up/down) or not (nonsign.) in the 12 treatment/control comparisons of the acute experiment. The control gene sets, heat shock factor (HSF) targets from the Daphnia-cisTarget validation and ribosomal proteins (ribos), were mostly not significantly enriched (grey bars).

