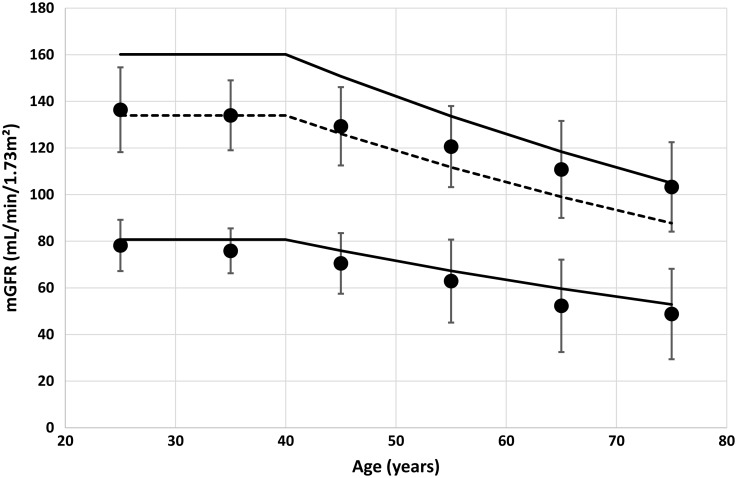
Fig. 3.
Upper and lower limits (solid circles) calculated from the meta-analysis data [6] with error bars (= 2 SD) (Table 2). The solid lines are calculated from the FAS equation with SCr/Q = 1.33 (lower limit) and SCr/Q = 0.67 (upper limit). The dashed line is calculated as mean FAS + ΔFAS.

