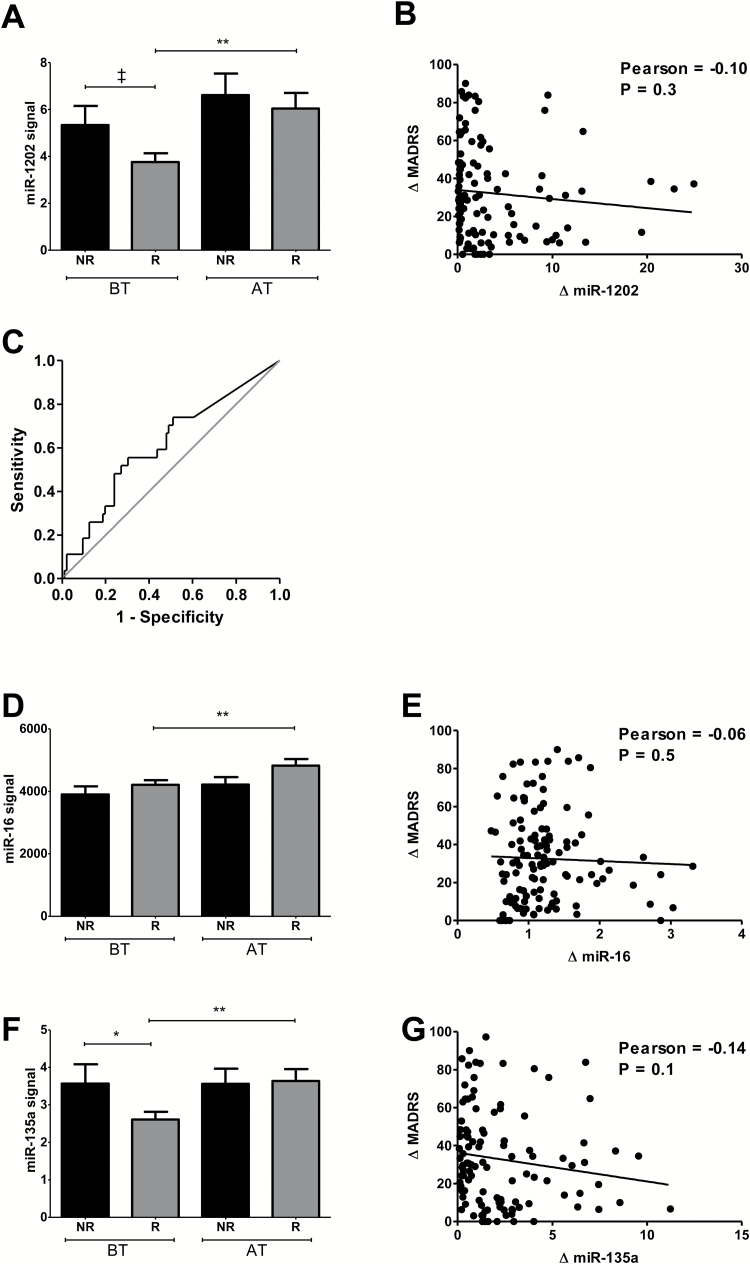
Figure 2.
Assessment of miRNA in Cohort 2. Levels of miR-1202 (A), miR-16 (D), and miR-135a (F) were quantified using Firefly BioWorks multiplex miRNA assay and normalized to the geometric means of miR-29b-3p, miR-19b-3p, Let-7i-5p, and Let-7b-5p. Assessments were performed in 27 nonresponders (black) and 97 responders (grey) at baseline (BT) and after treatment with duloxetine (AT). Changes in MADRS scores were calculated using the ratio of scores at AT over BT and are plotted against ratios at BT over AT for miR-1202 (B), miR-16 (E), and miR-135a (G). A ROC curve analysis was performed using baseline miR-1202 levels to predict nonresponse (C). *P<.05; **P<.01; ‡ 0.1<P>.05.

