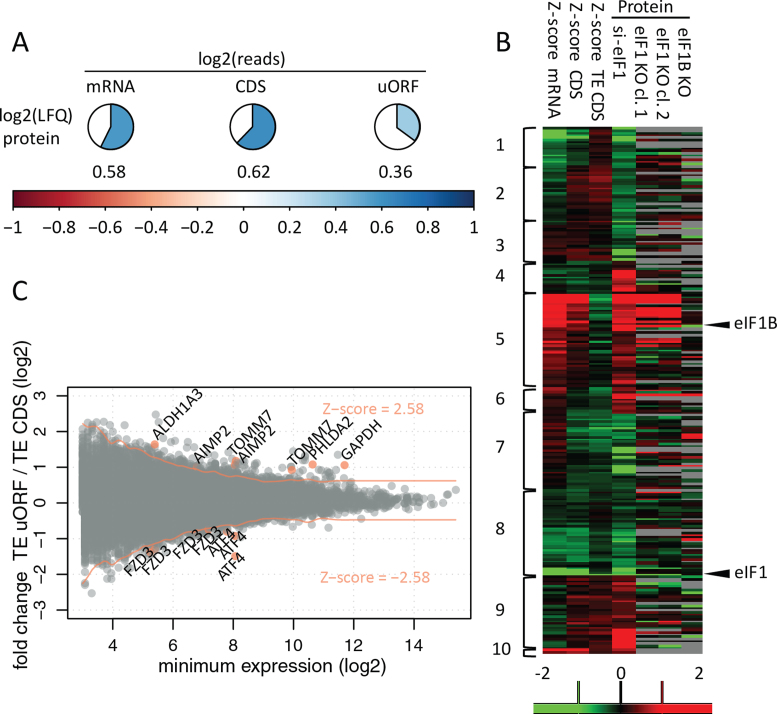
Figure 3.
Correlation and reproducibility at different OMICS levels. (A) Values represent average Pearson correlation coefficients for quantitative OMICS experiments performed in the si-Ctrl setup of HCT116 cells. LFQ; label free quantification of protein expression. (B) Identification of differentially expressed genes (P = 0.01) based on adjusted significance threshold in relation to data distribution obtained by Z-score transformation (Z-score cut-offs values of –2.58 and 2.58 corresponding to P = 0.01 are indicated with red lines). Three hundred thirty differentially regulated uORF/CDS pairs (from 245 transcripts) were identified at a 0.01 confidence level. Gene names were indicated for selected examples, also visualized in Figure 4, Supplementary Figures S2 and S3. (C). Significantly regulated proteins in the HCT116 shotgun proteomics experiment were clustered alongside their corresponding mRNA, CDS and TE CDS Z-score fold changes. Additionally, HAP1 LFQ data—not used for clustering—was visualized. Columns with protein data represent log2 fold change between average LFQ intensities when comparing knockdown/knockout versus control conditions. The scale ranges from red (upregulation in knockdown/knockout) to green (downregulation in knockdown/knockout) Clusters depict different modes of protein regulation: cluster 1—transcript downregulation; cluster 2—transcript downregulation not reflected by CDS translation; clusters 3 and 4—downregulated and upregulated proteins deviating from the expected transcript levels and translational regulation (31 proteins), respectively; cluster 5—transcript upregulation; cluster 6—transcript upregulation not reflected by CDS translation; cluster 7—translational downregulation; cluster 8—mixed (transcript and translational) downregulation; cluster 9—translational upregulation; cluster 10—mixed (transcript and translational) upregulation.

