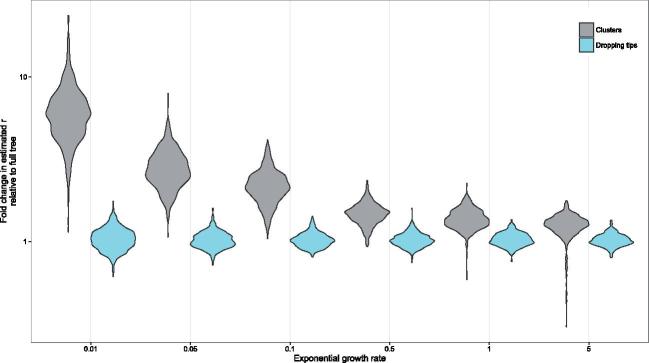
Figure 4.
Comparison of fold change in estimated r for downsampled trees relative to the full tree estimate for clusters (grey) and dropping tips (blue). Thresholds were chosen to obtain similar maximum cluster sizes across the different values of r (shown in Supplementary Fig. S1).

