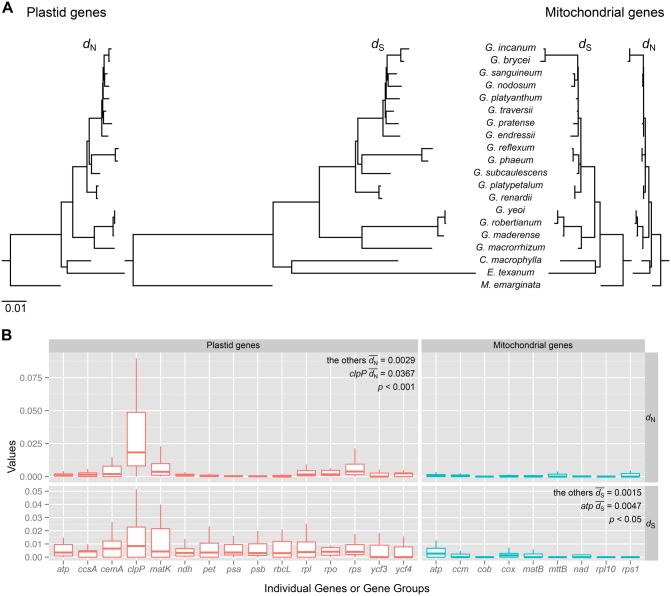
Fig. 1.
—Organelle gene divergence among 17 species of Geranium. (A) Plastid and mitochondrial phylograms of nonsynonymous (dN) or synonymous (dS) substitution rates based on 72 plastid and 26 mitochondrial genes, respectively. All trees are drawn to the same scale and scale bar indicates the number of substitutions per site. C., California; E., Erodium; G., Geranium; M., Monsonia. (B) Box plots of the values of dN and dS for Geranium plastid (red) and mitochondrial (blue) individual genes or functional groups of genes (see supplementary table S2, Supplementary Material online). The box represents values between quartiles, solid lines extend to minimum and maximum values, horizontal lines in boxes show median values but outliers were eliminated (see supplementary fig. S4 for outlier information, Supplementary Material online). Significance of fit was evaluated by pairwise Wilcoxon rank sum tests in the R package.

