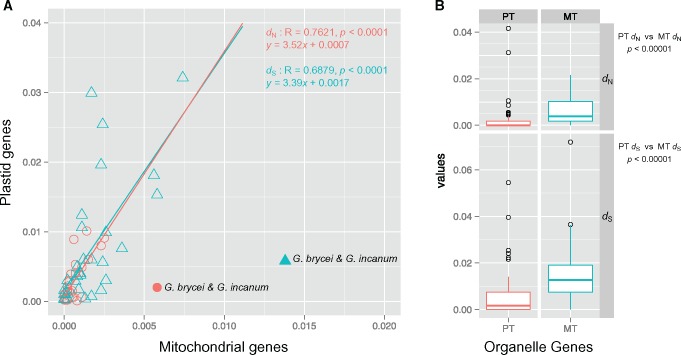
Fig. 2.
—Plastid and mitochondrial sequence divergence among Geranium species. (A) Correlation of nonsynonymous (dN, red circles) and synonymous (dS, blue triangles) substitution rates between each shared branch in the phylogram shown in supplementary fig. S3A, Supplementary Material online. Linear regression analyses included all branches except for the branch leading to G. brycei and G. incanum (closed circle and triangle). (B) Boxplot distribution of the dN and dS values for all individual organelle genes from G. brycei and G. incanum. The box represents values between quartiles, solid lines extend to minimum and maximum values, outliers are shown as circles and horizontal lines in boxes show median values. Significance of fit was evaluated by Pearson’s correlation and pairwise Wilcoxon rank sum tests in the R package. PT, plastid; MT, mitochondrion.

