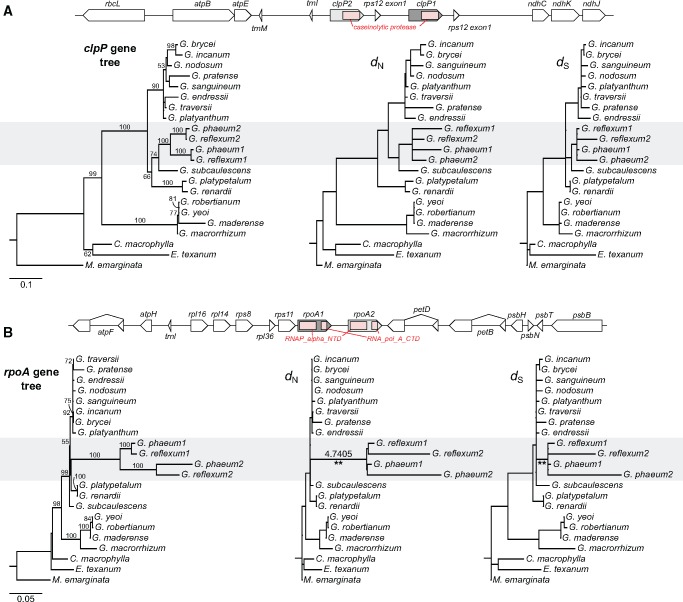
Fig. 3.
—Duplication of plastid-encoded clpP and rpoA genes in G. phaeum and G. reflexum. (A) Schematic diagram of the genomic regions surrounding the plastid clpP homologs from G. phaeum and G. reflexum. Pink box indicates conserved domain (caseinolytic protease). Maximum likelihood (ML) gene tree (left) based on clpP nucleotide sequences. ML phylograms used the constraint tree in supplementary fig. S3B, Supplementary Material online to show nonsynonymous (dN) or synonymous (dS) substitution rates of clpP (middle, right, respectively). (B) Schematic diagram of the genomic regions surrounding the rpoA homologs from G. phaeum and G. reflexum plastomes. Pink box indicates two conserved domains (RNA_alpha_NTD and RNA_pol_A_CTD). ML gene tree (left) based on rpoA nucleotide sequences. ML phylograms used the constraint tree in supplementary fig. S3B, Supplementary Material online to show dN and dS of rpoA (middle, right, respectively). Branches with significantly higher dN/dS (4.7405) detected by likelihood ratio test (LRT) are marked with two asterisks (P < 0.001 after Bonferroni correction; supplementary table S9, Supplementary Material online). Clade A2 within Geranium (supplementary fig. S3A, Supplementary Material online) that has duplication events is highlighted in gray. The numbers “1” and “2” after each species in the phylograms represent paralogs for clpP and rpoA. Bootstrap support values >50% are shown on the branches.

