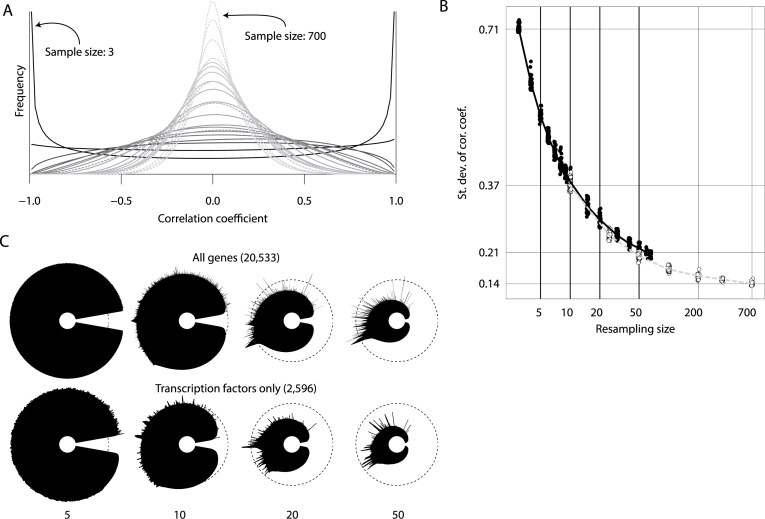
Figure 2.
Effect of sample size on icicle representation. Datasets with reduced sample size were obtained by resampling for both a subset of the Leucegene AML dataset (69 samples) and of the TCGA breast tumour dataset (754 samples). For each sample size explored, 50 datasets were prepared and correlation matrices built. (A) Distribution of correlation coefficients for one resampled dataset per sample size. Plain lines are used for resampled datasets derived from Leucegene AML and dashed lines for resampled datasets derived from TCGA breast tumours. The gray shade indicates the sample size, ranging from 3 (black) to 700 (light gray). (B) Standard deviation of correlation coefficients obtained from resampled datasets. The deviations shown on the vertical axis correspond to the average computed for the minimum and maximum sample size of both original datasets. Open circles: TCGA; dark circles: Leucegene (C) Icicle representations were built and displayed in MiSTIC for 5, 10, 20 and 50 samples with either all protein-coding genes or only genes coding for transcription factors. Note the increase in peak prominence as sample sizes increase to 50 specimens.

