Figure 3.
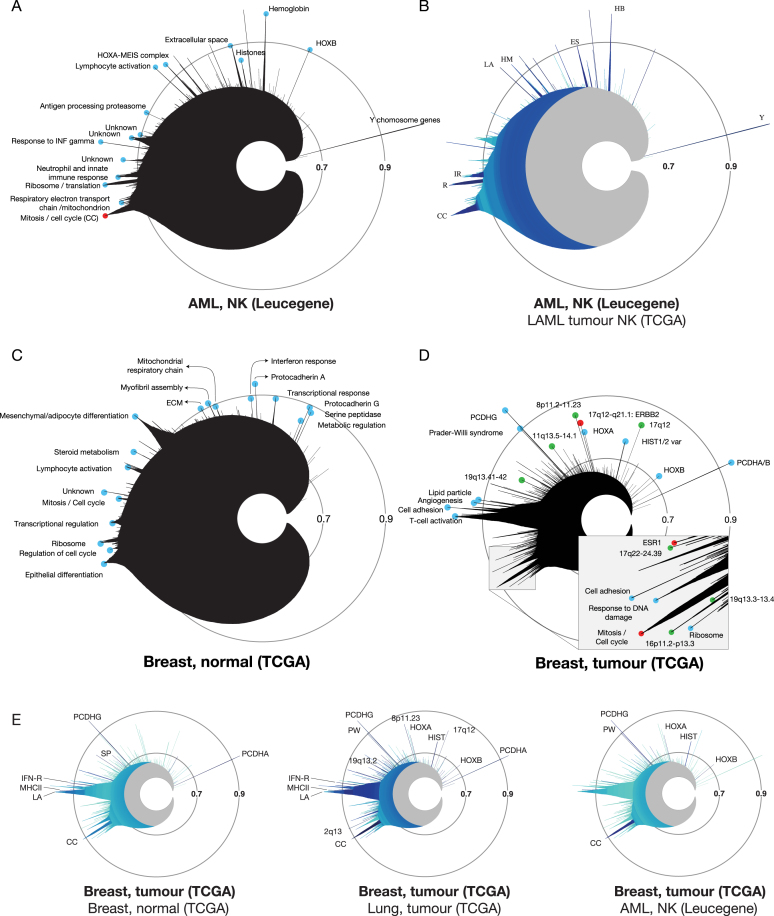
Imaging and comparing gene expression clusters in cancer and normal tissues with MiSTIC. (A) Icicle of the Leucegene AML NK dataset (dataset 2, Supplementary Table S1). Blue circles identify named peaks. The mitosis/cell cycle peak is labeled in red. (B) Comparative icicle of Leucegene versus TCGA AML NK datasets (dataset 2 versus 4). Dark shades indicate that similar clusters are found in both datasets while light blue indicates lack of conservation. (C) Icicle of normal TCGA breast samples (dataset 6, Supplementary Table S1). (D) Icicle of the TCGA breast tumour dataset (dataset 7, Supplementary Table S1). Green circles correspond to indicated chromosomal loci. The mitosis/cell cycle peak and peaks corresponding to the ESR1 and ERBB2 gene clusters are labeled in red. (E) Representations of the TCGA breast cancer icicle highlighted for conservation with normal breast tissue (dataset 6), lung adenocarcinoma (dataset 23) or TCGA AML NK (dataset 4). Abbreviations: CC: cell cycle/mitosis, ES: extracellular space, IFN-R: interferon response, HB: haemoglobin, HM: Hox Meis, IR: immune response, LA: lymphocyte activation, MHCII: MHC class II antigen processing and presentation, HIST: histones, PW: Prader-Willi syndrome, R: ribosome, SP: serine-protease activity, TR: transcriptional regulation, Y: Y chromosome.

