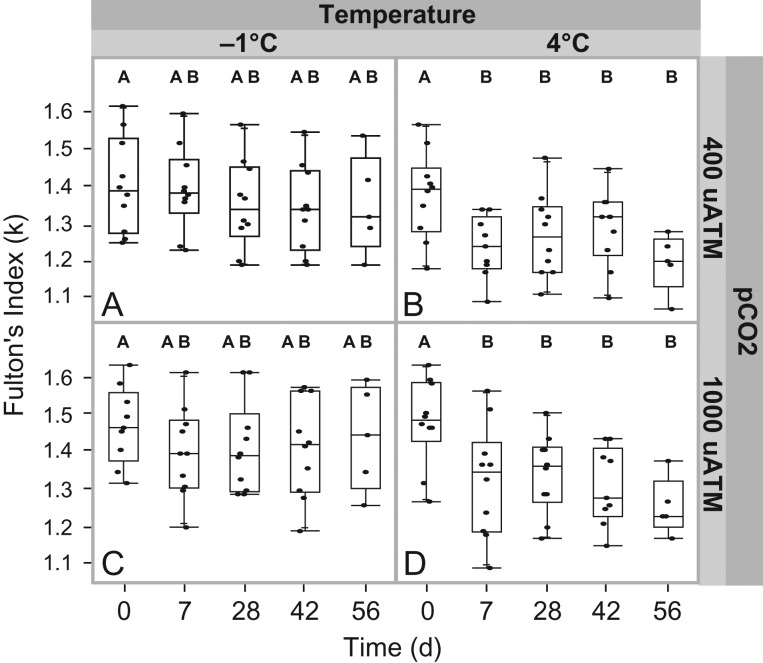
Figure 1:
Fulton's Index (±SE) calculated at 0, 7, 28, 42 and 56 days in Trematomus bernacchii to a control treatment (A), high temperature + low pCO2 (B), low temperature + high pCO2 (C), and high temperature + high pCO2 (D). Time points within a treatment not connected by the same letter are significantly different from each other.

