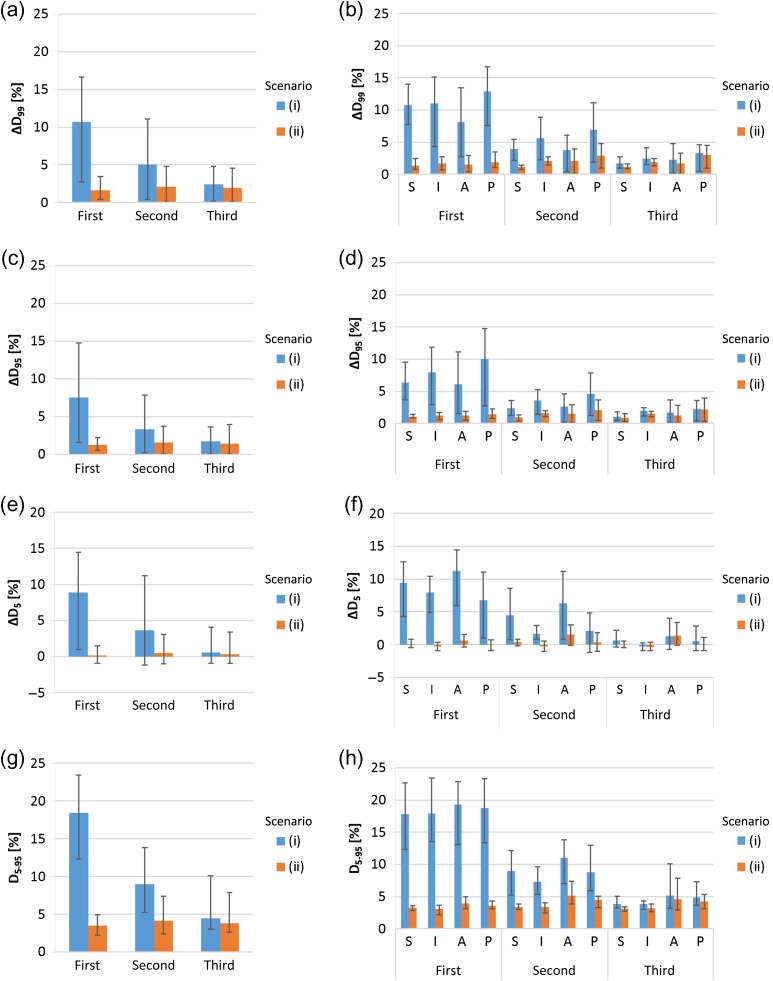
Fig. 4.
Averaged ΔD99(a), ΔD95(c), ΔD5(e) and D5–95(g) values from 36 cases (derived from nine patients and four directions) for each motion timing, with error bars indicating the maximum and minimum. Averaged ΔD99(b), ΔD95(d), ΔD5(f) and D5–95(h) values for nine cases, with error bars indicating the mean maximum and minimum for each target motion timing and direction of motion. The lateral margin size of these data is 3 mm. The lateral axes show the target motion timing.

