Figure 1.

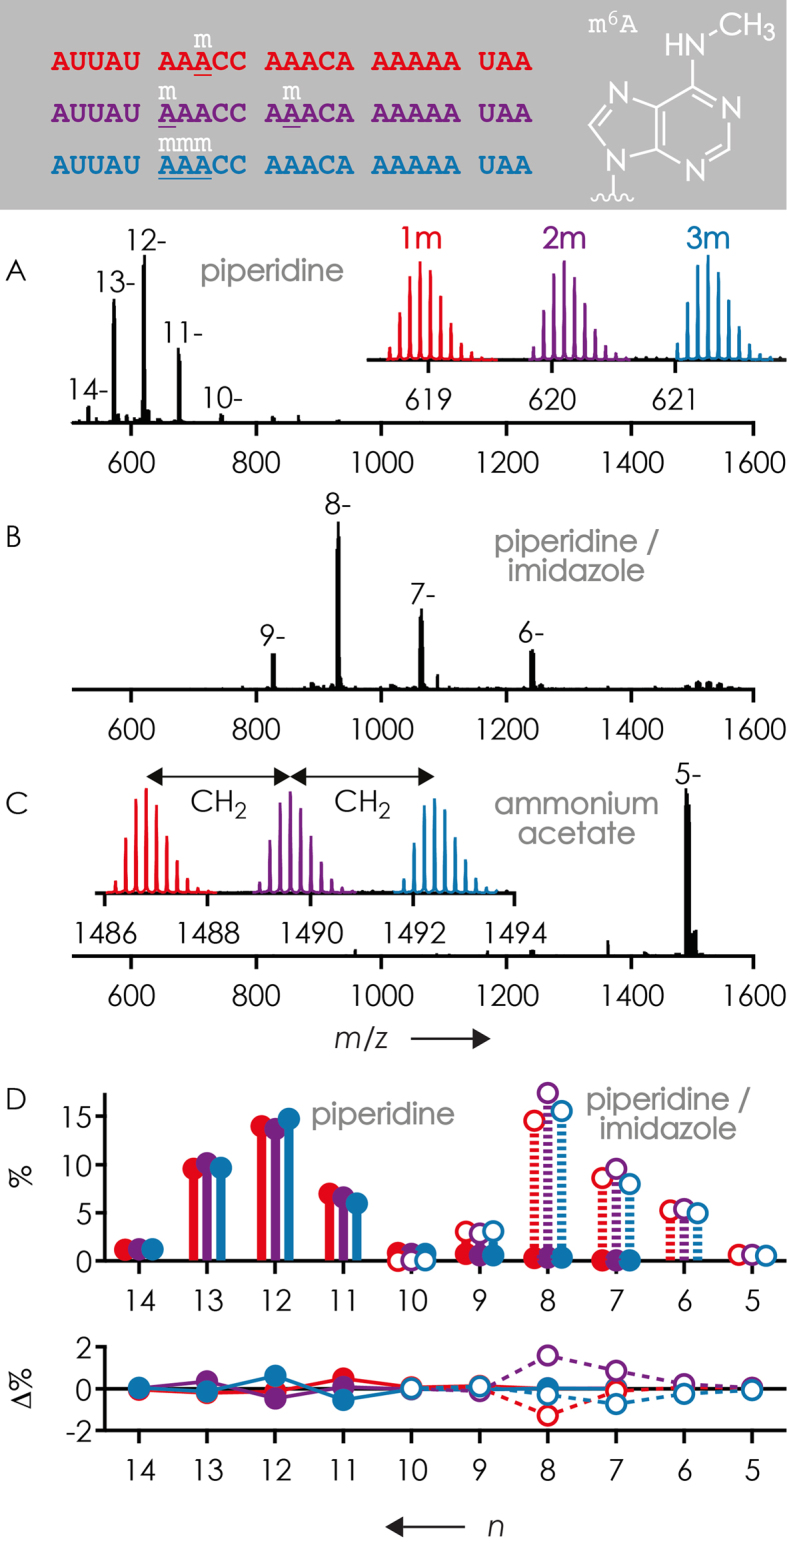
Mass spectra from ESI of 1:1:1 mixtures of 23 nt RNAs 4, 5 and 6 (0.5 or 1 μM each) in 1:1 H2O/CH3OH using (A) 25 mM piperidine, (B) 25 mM piperidine and 25 mM imidazole and (C) 20 mM CH3COONH4 as additives, insets show expanded regions with isotopic profiles of the most abundant (M−nH)n− ions and (D) corresponding yield of (M−nH)n− ions (top) and deviation from average yield (bottom) for piperidine (filled circles) and piperidine/imidazole (open circles) versus net charge. Color coding refers to the number of m6A residues: red for 1 (RNA 4), violet for 2 (RNA 5) and blue for 3 (RNA 6).
