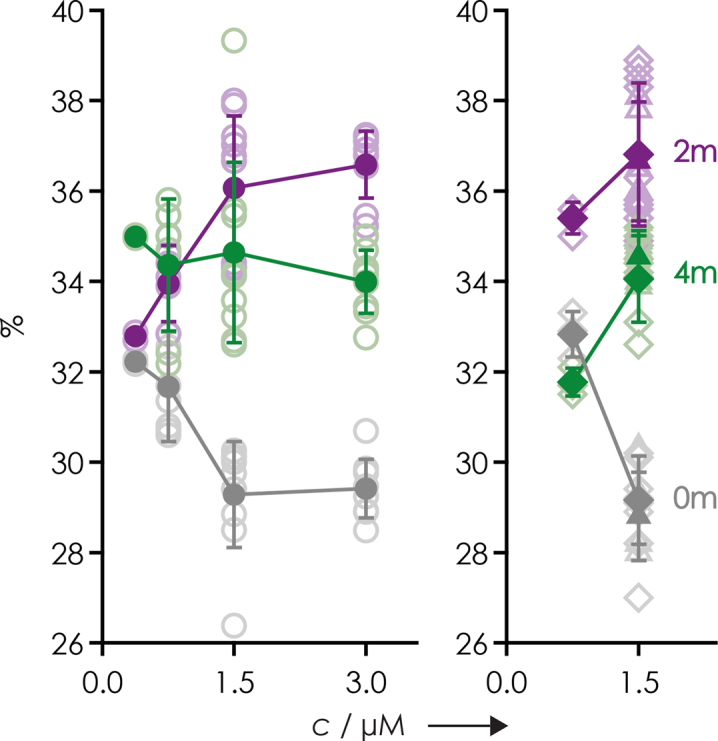
Figure 3.

Yield of (M−nH)n− ions from ESI of 1:1:1 mixtures of 15 nt RNAs 1, 2 and 3 in 1:1 H2O/CH3OH versus total RNA concentration with 20 mM piperidine (circles), 20 mM piperidine and 20 mM imidazole (diamonds), or 20 mM ammonium acetate (triangles) as additive. Open symbols represent data from individual spectra and filled symbols show average values with standard deviations as error bars. Color coding refers to the number of m5U residues: gray for 0 (RNA 1), violet for 2 (RNA 2) and green for 4 (RNA 3).
