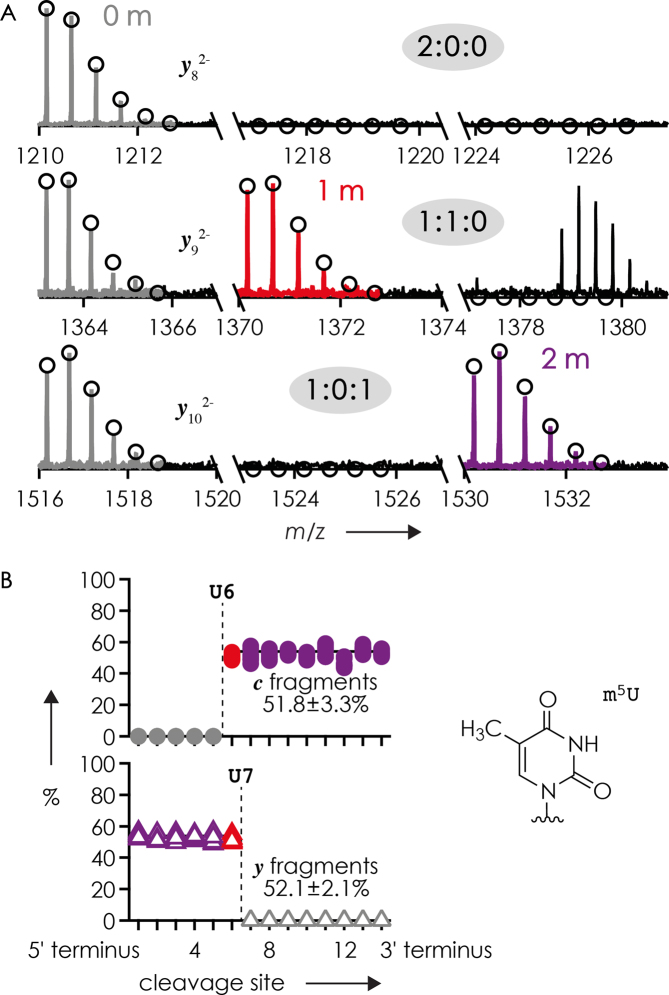
Figure 6.
(A) Unmethylated (left), singly methylated (middle), and doubly methylated (right) y8, y9 and y10 fragments (color coding as in Figure 2) and (B) fraction of methylated c (top) and y (bottom) fragments from CAD (48, 50, 52 or 54 eV laboratory frame energy) of (M−4H)4− ions from ESI of a 1:1 mixture of 15 nt RNA forms 1 and 2 (from 10 measurements, 0.25, 0.5 or 1 μM of each RNA form in 1:1 H2O/CH3OH with 20 mM piperidine and 20 mM imidazole or 20 mM ammonium acetate) versus cleavage site; dashed lines indicate m5U at sites 6 and 7 of RNA 2.

