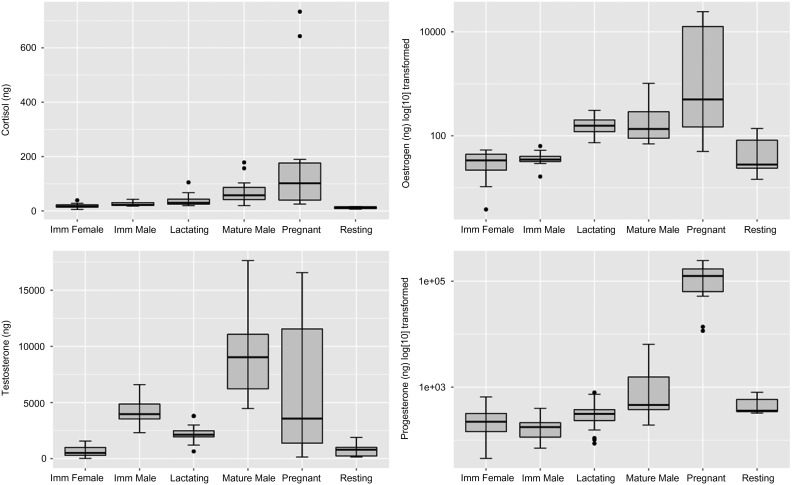
Figure 1:
Boxplots of hormone metabolites extracted from faecal samples of North Atlantic right whales (Eubalaena glacialis). Plots were produced using the ggplot2 library (Wickham, 2009) of R 3.3.1 running under RStudio. Upper and lower limits of the box are 25% and 75% quantiles; box mid-lines are medians. Upper and lower whiskers show values to 1.5 times the distance between the 25 and 75% quartiles. Dots indicate outliers. Oestrogen and progesterone values are log10 transformed.

