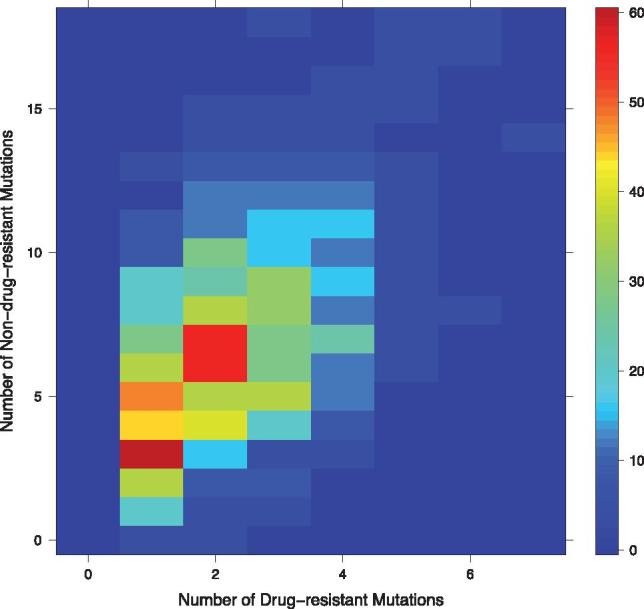
Figure 2.

Heatmap plot showing the correlation between the frequency of drug resistance mutations (counts of amino acid replacements) in a sequence and the number of non-drug resistance mutations accumulated from 1996 onwards in protease sequences. The y-axis indicates the frequency of non-drug resistance mutations accumulated with respect to the number drug resistance mutations, while the x-axis shows the number drug resistance mutations. The colour of the square bins indicates the number of sequences in the data that have the frequency of non-drug resistance associated mutations.
