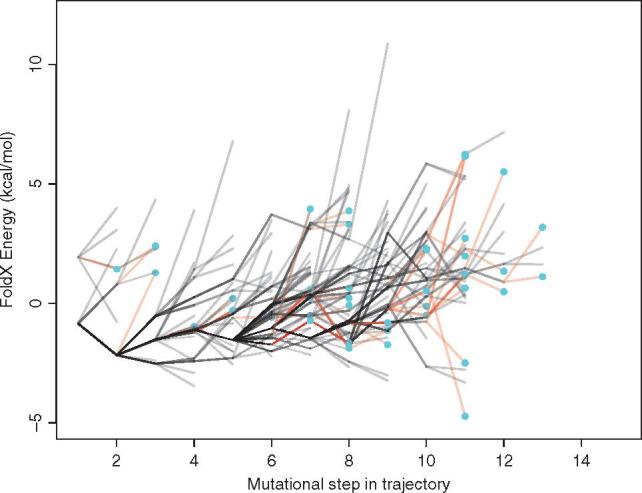
Figure 3.

Energy landscape showing trajectory energies for HIV-1 protease protein for both resistant and non-resistant sequences. Each trajectory is plotted in grey, with frequently shared paths appearing to be darker. The red lines indicate the step in resistance trajectories just before a resistance mutation is acquired (indicated by the blue circles). The y-axis represents the predicted difference in energy between each mutant and the wild-type strain (ΔΔG). Each line on the x-axis represents a mutational step between a parent and child node starting from the first descendant of the most recent common ancestor. Note, the energy changes are cumulative.
