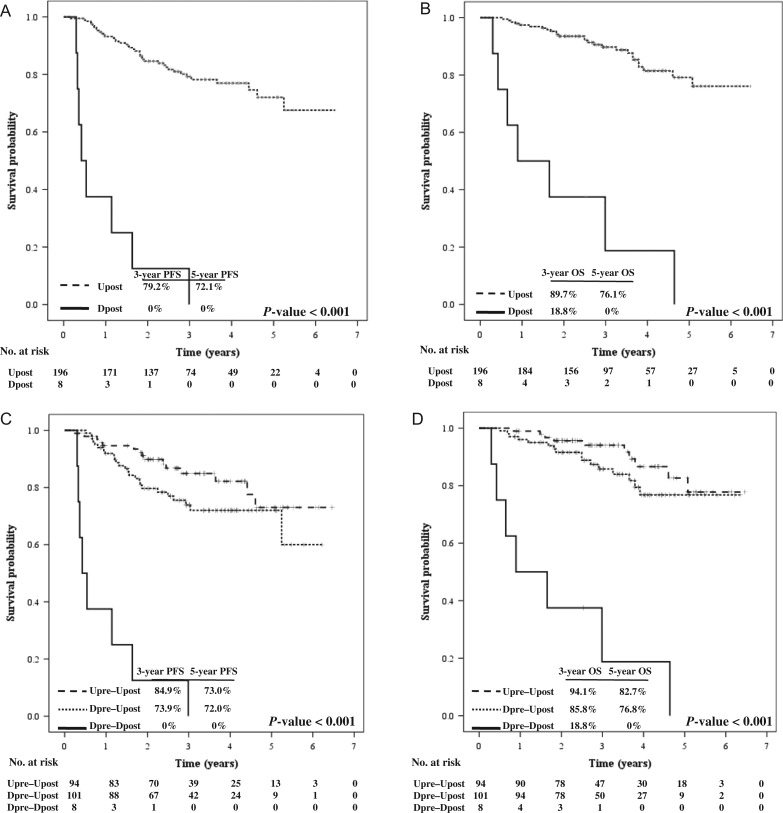
Fig. 3.
PFS (A) and OS (B) according to plasma EBV DNA level post-treatment, and PFS (C) and OS (D) according to dynamic change in plasma EBV DNA level post-treatment. PFS = progression-free survival; OS = overall survival, U = undetectable, D = detectable; Upre = EBV DNA undetectable pre-treatment, Upost = EBV DNA undetectable post-treatment, Dpre = EBV DNA undetectable pre-treatment, Dpost = EBV DNA undetectable post-treatment.

