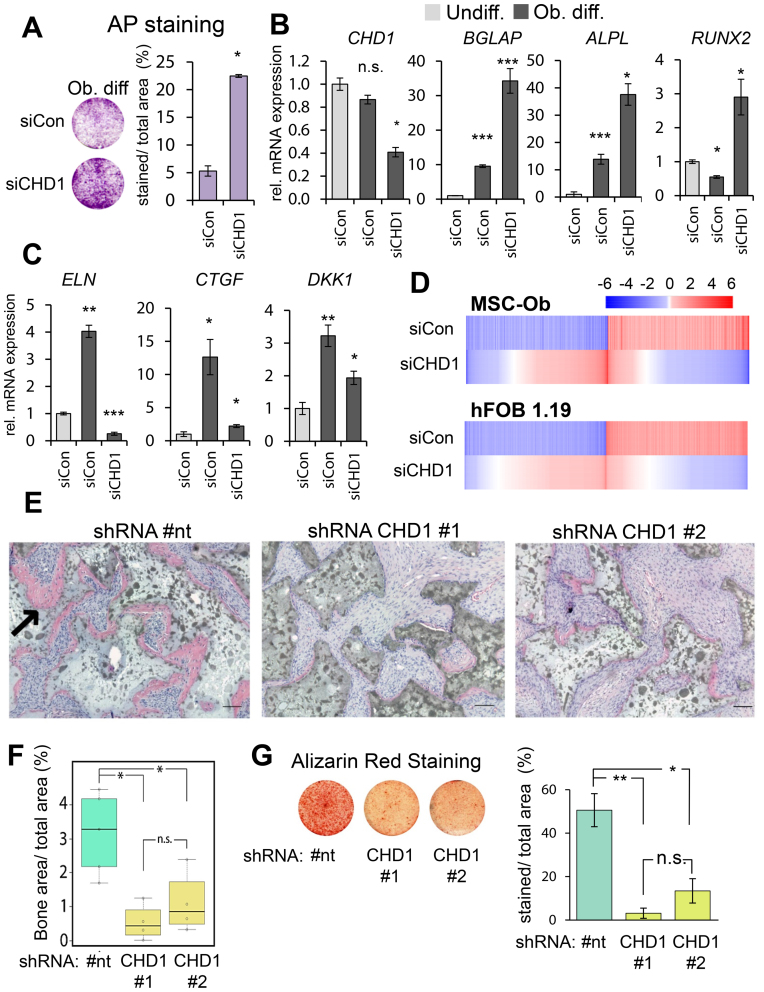
Figure 1.
CHD1 depletion impairs osteoblast differentiation in MSC and hFOB 1.19. (A) Osteoblast-differentiated mesenchymal stem cells (Ob. diff) transfected with control (siCon) or CHD1 (siCHD1) siRNAs were stained for alkaline phosphatase (AP) activity. Mean values ± SD (n = 2), with P-value shown. qRT-PCR gene expression analysis of CHD1 and the osteoblast-specific genes ALPL, BGLAP, RUNX2 (B) and DKK1, ELN, CTGF (C) in undifferentiated (Undiff.) and osteoblast-differentiated (Ob. diff) mesenchymal stem cells transfected with control (siCon) or CHD1 targeting siRNA (siCHD1). Values were normalized to 18S rRNA and quantified relative to control undifferentiated samples. Mean ± SD, (n = 3) (*P-value < 0.05; **P-value < 0.01; ***P-value < 0.001). (D) Heatmaps depict log2-fold changes of gene expression in MSC and human fetal osteoblasts (hFOB 1.19) during osteoblast differentiation. Relative changes upon siCHD1 treatment (Diff. +siCHD1) compared to differentiation-associated changes in gene expression are shown in the lower panel of each heatmap. Genes were sorted by log2-fold changes with siCHD1 treatment and differentiation-regulated genes were selected by adjusted P-value < 0.05 and ±0.5 log2-fold changes. (E) Representative H&E stained tissue sections of ectopic bone formation (pink area; see black arrow) in SCID mice implanted with MSC stably expressing a non-targeting (#nt) or CHD1-targeting shRNAs (#1, #2). Mice were sacrificed 8 weeks after implantation. Scale bars represent 100 μM. (F) Boxplots show the quantification of ectopic bone formation of control and CHD1-shRNA expressing MSC with each point representing one biological replicate. The ratio of bone area (BA) over total area (TA) was compared with Tukey multiple comparison test with a threshold at 0.05 (*). (G) Representative images of Alizarin Red S staining of MSC differentiated for 14 days in control (#nt) and CHD1-depleted (CHD1 #1, #2) are shown with the quantification of the relative percentage of stained area over total area (n = 3; * P-value < 0.05).

