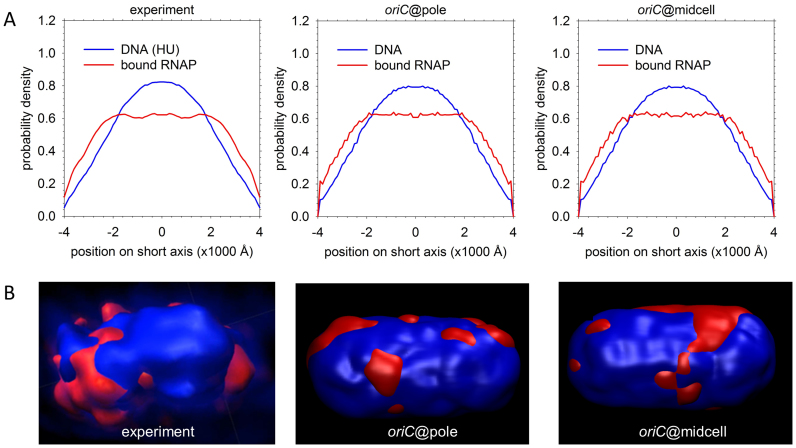
Figure 5.
Reproduction of experimental DNA and RNAP density data. (A) Short-axis distributions of bound RNAP (red) and DNA (indicated by nonspecific HU binding; blue). The left panel shows experimental data for cells grown in minimal medium (34), while the two right panels depict population averages of these distributions for the sets of oriC@pole and oriC@midcell structures. (B) Left: experimental 3D surface rendering of a nucleoid from a cell grown in minimal medium, with DNA (indicated by HU binding) in blue and bound RNAP in red (figure reproduced from (34)). Panels on the right are surface renderings of two representative 500 BPB structures in which bulk DNA is blue and RNAP-bound DNA is red. [Reproduced in part from Stracy,M., Lesterlin,C., de Leon,F.G., Uphoff,S., Zawadzki,P. and Kapanidis,A.N. (2015) Live-cell superresolution microscopy reveals the organization of RNA polymerase in the bacterial nucleoid. Proc. Natl. Acad. Sci. U.S.A., 112, E4390–E4399.].

