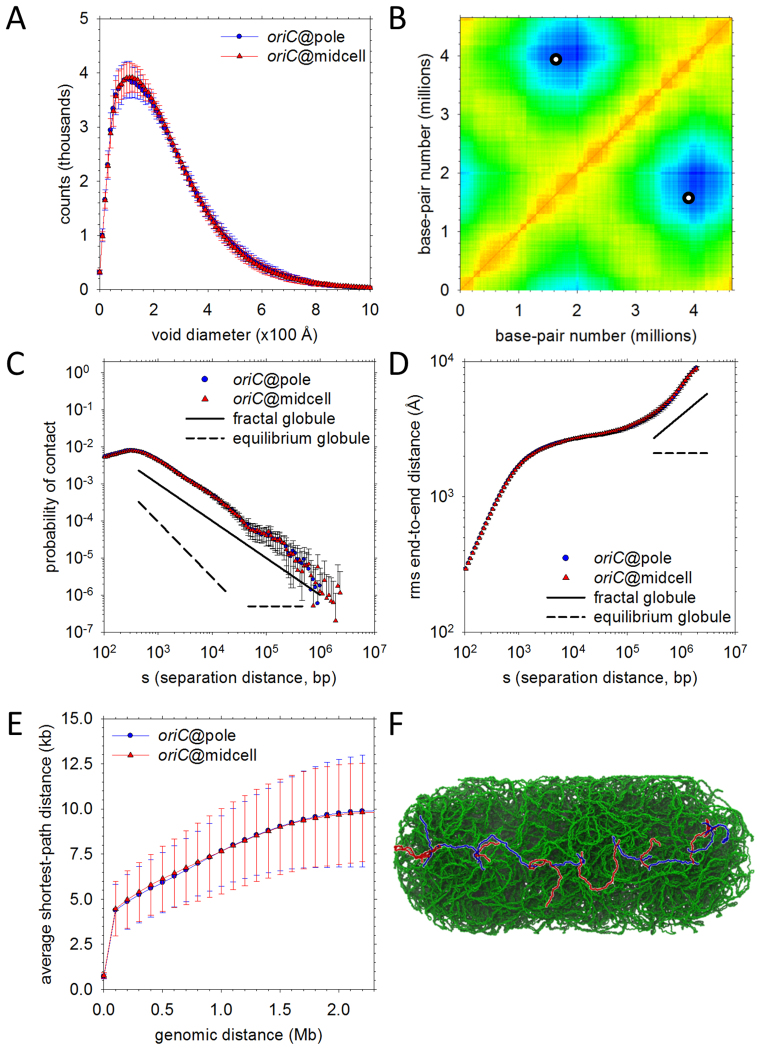
Figure 6.
Physical properties of the final high-resolution models. (A) Distributions of void sizes in the oriC@pole (blue) and oriC@midcell (red) models. (B) A contact map (‘heat map’) for the oriC@pole model set. Mean distances between chromosomal loci binned into 10 kb blocks are plotted; the color in each x-y (locus–locus) bin reflects the distance between those loci on a scale ranging from red (distance = 0) to blue (distance = maximum measured distance). Points on the map that would denote contacts between oriC and a genomically-opposite locus within ter appear as two (equivalent) white circles. (C) Probability of contact as a function of genomic separation. Plots for oriC@pole (blue) and oriC@midcell (red) models are compared to ideal plots representing fractal globule (solid line) and equilibrium globule (dashed line) scaling behavior. Probability of contact in the ideal fractal globule scales as s−1 over a substantial range of separations, while the equilibrium globule probability initially scales as s−3/2 before assuming a constant value at longer separations. (D) Same as (C), but comparing root-mean-square end-to-end distances. The idealized scaling exponents represented are s1/3 (fractal globule) and s0 (equilibrium globule). (E) Shortest paths between genomic loci. Mean shortest paths as a function of genomic separation are plotted for oriC@pole (blue) and oriC@midcell (red) models. Path lengths are determined by solving for the shortest path comprising only 1D diffusion along DNA and intersegmental jumps between regions in close physical contact (see Supplementary Data for details). (F) Example of the shortest path between loci at opposite nucleoid poles. An intersegmental jump between different plectonemic regions is represented as a color change from blue to red or red to blue along the path.

