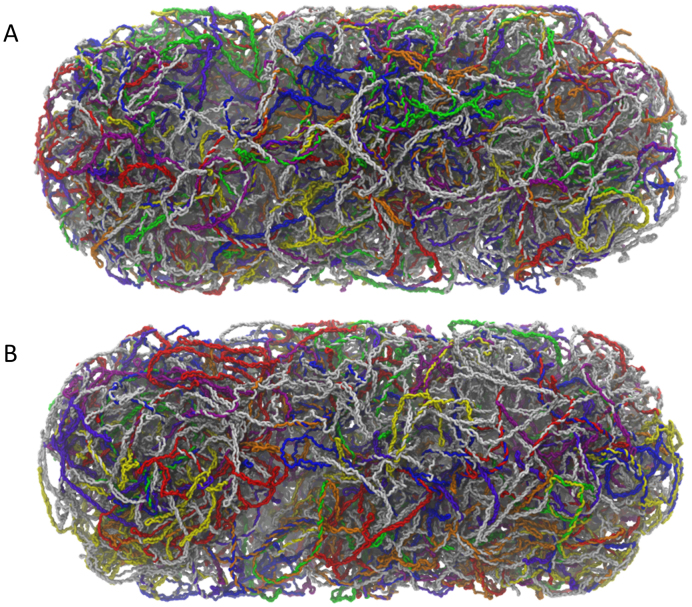
Figure 7.
Distribution of operons in the chromosome models. (A) The positions in the most representative oriC@pole structure of all operons listed in RegulonDB (70) that contain at least two genes are depicted: each such operon is represented as a single color assigned by cycling through a 7-element spectrum over the list of 851 operons. Regions not covered by multigene operons are represented in white. (B) Same as (A), but for the most representative oriC@midcell structure.

