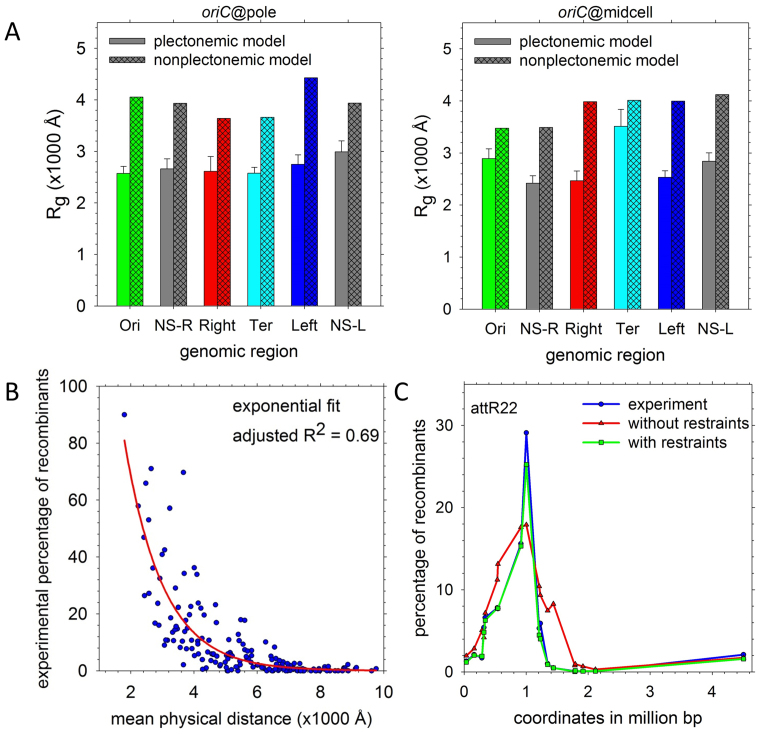
Figure 8.
Macrodomain organization in the chromosome models. (A) Radii of gyration of each of the regions defined by Valens et al. (75) in the ‘true,’ plectonemic model sets (solid bars) compared with those of a non-plectonemic model with equivalent positioning of oriC (hashed bars). (B) Recombination frequencies from Valens et al. (75) plotted versus the mean physical distances between the recombining loci in the 40 chromosome structures (blue); the red line indicates a single-exponential fit to the data. (C) A representative plot of recombination frequencies predicted by mean physical distance in the structures before (red) and after (green) imposition of distance restraints compared with the experimentally-determined frequencies (blue). Experimental data are from (75); analogous plots for other recombining loci appear in Supplementary Figure S11.

