Figure 9.
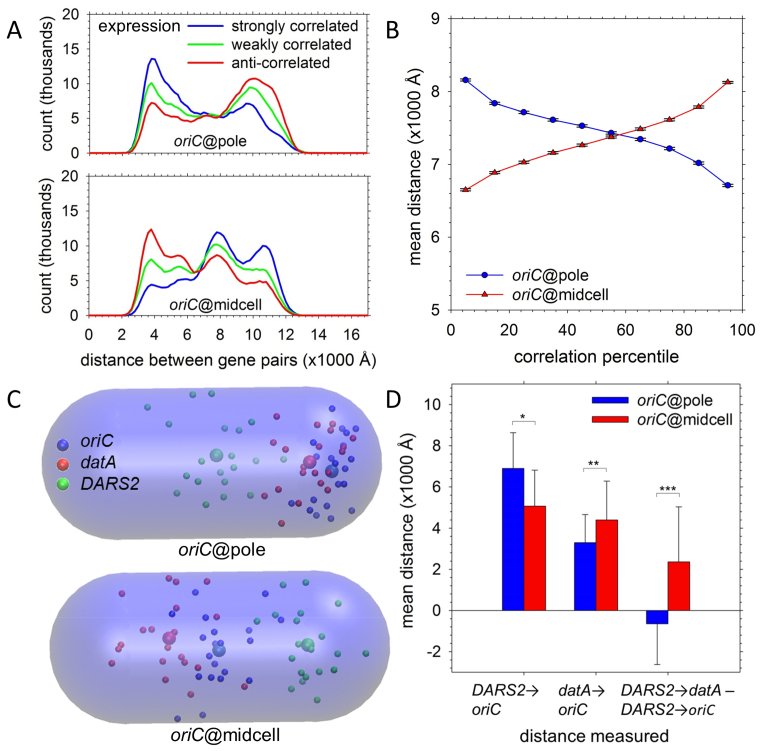
Gene and regulatory element positioning. (A) Distribution of the mean distances between gene pairs separated by 1.5 Mb whose coexpression was ranked in the top 10% (blue), middle 10% (green) and bottom 10% (red) of all gene pairs by Pearson correlation coefficients. Upper panel shows results for the set of 20 oriC@pole structures; lower panel shows results for the set of 20 oriC@midcell structures. (B) Mean distances for 10 deciles of coexpression profiles are plotted for oriC@pole (blue) and oriC@midcell (red). Gene pairs were grouped into deciles by the Pearson correlation coefficient of their expression profiles; as plotted, the correlation coefficient (strength of co-expression) rises from left to right. Error bars indicate the 99.9% confidence interval for each mean. (C) Spatial positions of oriC (blue), datA (red) and DARS2 (green) in the 20 individual structures are plotted as small spheres; larger spheres represent the mean position of each locus in the indicated global model type. The transparent capsule corresponds to the nucleoid volume. (D) At left, mean distances to oriC are plotted for DARS2 and datA in oriC@pole (blue) and oriC@midcell models (red). At right, mean differences between the DARS2-to-datA distance and DARS2-to-oriC distance are plotted for oriC@pole (blue) and oriC@midcell (red). P-values were calculated with Welch two-sample t-tests (*P < 0.05; **P < 0.005; ***P < 0.0005).

